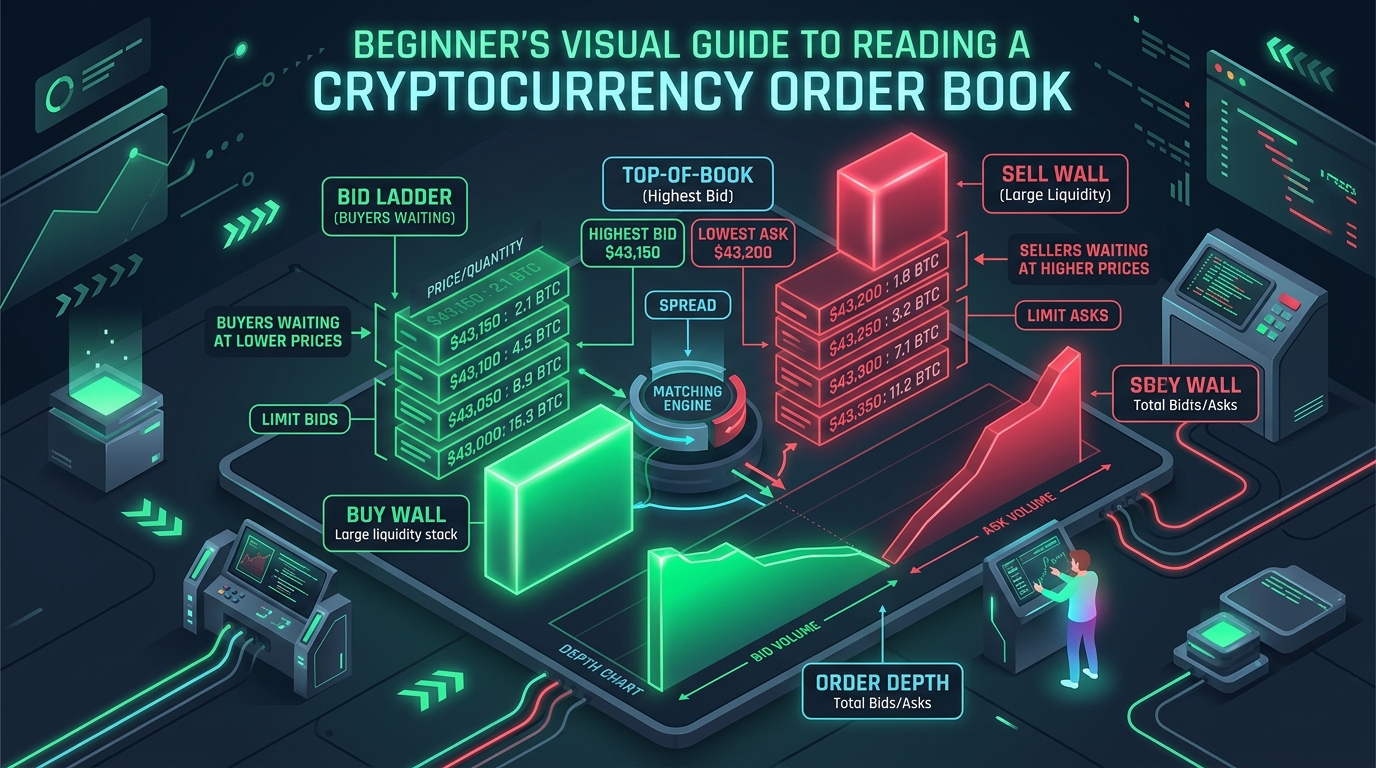
If you have ever opened a professional cryptocurrency exchange like Binance, Coinbase Pro, or Kraken, you were probably greeted by a screen that looks like the matrix:
Columns of glowing green numbers on the bottom, columns of flashing red numbers on the top, numbers flickering and changing hundreds of times per second.
Most beginners get overwhelmed, ignore this window, and rely purely on simple price line charts.
That is a costly mistake.
A price chart only tells you what happened in the past. The Order Book shows you what traders are willing to do right now in the present—and where the market is likely to move in the immediate future.
In this visual, step-by-step explainer, we will take the mystery out of the crypto order book so you can read market depth, spot deceptive manipulation walls, and execute trades with complete confidence.
1. The Anatomy of an Order Book: The Three Core Zones
At its core, an order book is simply a live public ledger of all unfulfilled limit orders organized by price.
It is divided into three primary zones:
[ THE LEVEL-2 ORDER BOOK ANATOMY ]

  ┌────────────────────────────────────────────────────────────────────────┐
  │  PRICE (USDT)   │  AMOUNT (BTC)   │  TOTAL VALUE (USDT)  │  ZONE       │
  ├─────────────────┼─────────────────┼──────────────────────┼─────────────┤
  │   $65,020.00    │      4.50       │     $292,590.00      │             │
  │   $65,015.00    │      2.10       │     $136,531.50      │  RED ASKS   │
  │   $65,010.00    │      1.25       │      $81,262.50      │  (SELLERS)  │
  │   $65,005.00    │      0.80       │      $52,004.00      │             │
  ├─────────────────┴─────────────────┴──────────────────────┼─────────────┤
  │  ◄── THE SPREAD: $5.00 ($65,005.00 Ask - $65,000.00 Bid) ──►  MID-MARKET │
  ├─────────────────┬─────────────────┬──────────────────────┼─────────────┤
  │   $65,000.00    │      1.10       │      $71,500.00      │             │
  │   $64,995.00    │      3.40       │     $220,983.00      │ GREEN BIDS  │
  │   $64,990.00    │      5.00       │     $324,950.00      │  (BUYERS)   │
  │   $64,980.00    │     12.50       │     $812,250.00      │             │
  └────────────────────────────────────────────────────────────────────────┘
1. The Red Zone: Asks (Sell Orders)
2. The Green Zone: Bids (Buy Orders)
3. The Middle: The Bid-Ask Spread
Spread = $65,005.00 - $65,000.00 = $5.00 (0.0077%).2. How the Matching Engine Works: Market vs. Limit Orders
Why don’t bids and asks just sit in the order book forever? How does an actual trade happen?
Understanding this requires knowing the difference between Makers (Limit Orders) and Takers (Market Orders):
[ HOW TRADES EXECUTE: MAKER vs. TAKER ]

  MAKER (Patience):                     TAKER (Urgency):
  You place a Limit Buy at $64,990.     You click "Market Buy 2 BTC Now".
  ────────────────────────────────      ────────────────────────────────
  • You don't want to pay $65,005.      • You need Bitcoin immediately.
  • Your order SITS in the green book.  • Engine instantly MATCHES your order
  • You "MAKE" liquidity for others.      against the lowest RED ASKS.
  • You pay lower Maker Fees (e.g. 0.02%)• You "TAKE" liquidity off the book.
                                        • You pay higher Taker Fees (e.g. 0.05%)
Unique Example: Alice and Bob at the Farmers Market
Think of an order book like a stall at a farmers market:
3. How to Read the Visual Depth Chart
Next to the number columns on most exchanges, you will see a graphical chart with two colored hills: a green hill on the left and a red hill on the right. This is the Depth Chart:
[ THE VISUAL DEPTH CHART EXPLAINED ]

  CUMULATIVE
  VOLUME (BTC)
      ▲
  500 ┼                                                                      ██
  400 ┼                                                                  ██████
  300 ┼                                                              ██████████ ◄── STEEP SELL WALL
  200 ┼         ██                                               ██████████████     (Heavy Resistance)
  100 ┼     ████████                                         ██████████████████
   50 ┼ █████████████████                                ██████████████████████
    0 ┼───────────────────────▲─────────────────────▲──────────────────────────►
     $64,800               $65,000               $65,200                PRICE
            [ GREEN BIDS ]         [ SPREAD GAP ]        [ RED ASKS ]
           (BUYING SUPPORT)                             (SELLING PRESSURE)
What the Slopes Mean:
4. Decoding "Buy Walls" and "Sell Walls"
When looking at an order book or depth chart, you will frequently spot sudden massive spikes:
[ BUY WALL vs. SELL WALL ]

  BUY WALL (Support Barrier):              SELL WALL (Resistance Ceiling):
  A single bid of 250 BTC at $64,500.      A single ask of 300 BTC at $66,000.
  ───────────────────────────────────      ───────────────────────────────────
  • The price cannot drop below $64,500    • The price cannot rise above $66,000
    until sellers dump 250 BTC into it.      until buyers purchase all 300 BTC.
  • Acts as strong psychological floor.    • Acts as strong psychological lid.
The Danger of Spoofing (Fake Walls)
Never assume every wall you see is real! In crypto markets, manipulative trading bots frequently engage in Order Spoofing:
> Golden Rule: If a wall vanishes in a single microsecond the moment price touches it, you just witnessed an algorithmic spoof.
5. Level 1 vs. Level 2 vs. Level 3 Order Books
As you advance in crypto trading, you will encounter three tiers of market data feeds:
| Data Tier | What It Shows | Who Uses It |
|---|---|---|
| Level 1 (Top-of-Book) | Best Bid, Best Ask, and Last Traded Price only | Casual portfolio trackers & mobile apps |
| Level 2 (Market Depth) | Top 20 to 100 price levels with cumulative volume on both sides | Active traders, swing traders & technical analysts |
| Level 3 (Full Order Queue) | Every individual order ID with exact queue queue position and queue latency | Institutional HFT algorithms & quantitative market makers |