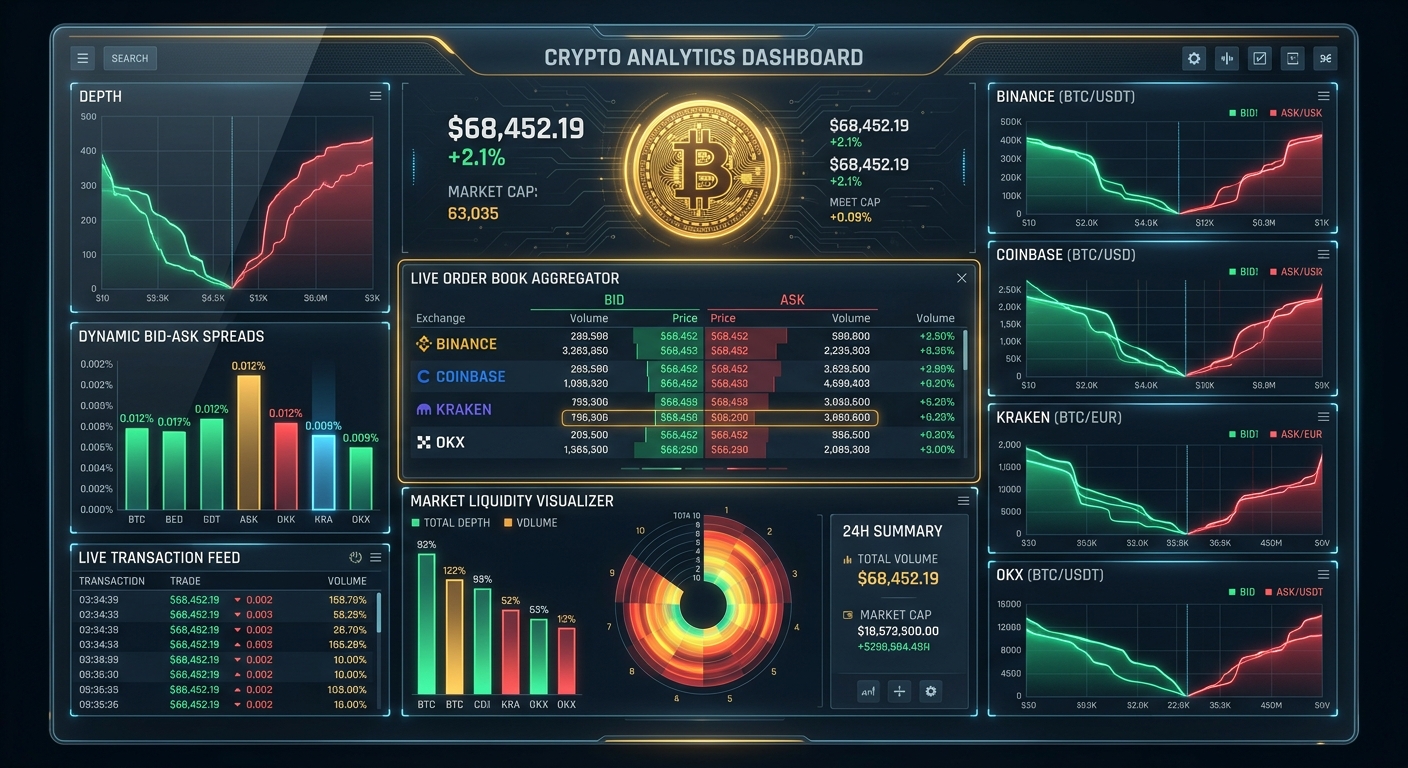
Imagine you are managing an institutional crypto treasury or trading an active seven-figure personal portfolio. You decide to purchase 25 Bitcoin. You quickly glance at the homepage tickers of three leading exchanges: Binance displays $96,200, Coinbase shows $96,250, and Kraken shows $96,280.
The naive decision seems elementary: immediately smash the market buy button on Binance to capture the "$80 discount." You fire the order. When the confirmation receipt prints, your average filled price is $96,490—costing you $7,250 more than anticipated. How did the "cheapest" exchange end up giving you the worst fill in the market?
Welcome to the high-stakes science of Bitcoin price comparison across exchanges. In fragmented digital asset markets, comparing superficial top-of-book tickers without evaluating order book depth, execution slippage, fee tiers, and liquidity replenishment is one of the most expensive mistakes a trader can make.
In this advanced masterclass, we will deconstruct how to perform rigorous, real-time Bitcoin price comparisons across global venues, break down the mathematics of institutional Smart Order Routing (SOR), and reveal how professional desks consistently achieve best execution.
Section 1: The Three Levels of Bitcoin Price Comparison
To accurately compare Bitcoin prices across exchanges, you must understand the three distinct hierarchical levels of market data:
Level 1: Last Traded Price (LTP) — The Retail Illusion
The Last Traded Price is simply the price at which the most recent historical transaction cleared. It represents past history, not current executable reality. If a retail trader bought 0.001 BTC on Exchange A at $96,500 ten seconds ago, while aggressive market selling on Exchange B pushed the last trade to $96,200, the LTP suggests a $300 gap. However, the current resting orders on Exchange A might already be down at $96,210. Never base real-time trading decisions on LTP.
Level 2: Top-of-Book Executable Quotes (BBO / EBBO)
The Best Bid and Offer (BBO) represents the highest price someone is currently willing to pay (Best Bid) and the lowest price someone is currently willing to sell (Best Ask) on a specific exchange. When comparing multiple exchanges simultaneously, the highest bid across all venues is the Exchange Best Bid (EBB) and the lowest ask is the Exchange Best Offer (EBO). The difference between them is the Consolidated EBBO Spread.
While BBO is vastly superior to LTP, it only guarantees execution for minuscule quantities (often less than 0.1 BTC).
Level 3: Depth-Adjusted Volume-Weighted Average Price (VWAP) — Institutional Reality
For any order size greater than pocket change, the only metric that matters is the Depth-Adjusted VWAP. VWAP calculates the true weighted average price you will pay when your order sweeps through multiple rungs of the order book ladder:
VWAP = (Σ (Price_i * Volume_i)) / Total_Order_SizeAn exchange quoting $96,200 with only 0.5 BTC of ask depth before escalating to $96,600 has a much worse VWAP for a 10 BTC order than an exchange quoting $96,240 with 50 BTC of resting liquidity within a $10 band.
Section 2: Real-World Multi-Venue Execution Breakdown
To see the power of multi-exchange price comparison in action, let us analyze a live execution scenario. A trader wants to purchase 20 BTC across three competing exchanges with identical fee structures (0.10% taker fee):
Exchange A (Offshore Liquid Giant - Thin Top Spread)
Execution Outcome on Exchange A: Sweeping all 5 levels to fill 20 BTC yields a total cost of $1,929,430, resulting in an effective average VWAP of $96,471.50.
Exchange B (Regulated Institutional Venue - Deep Clustered Book)
Execution Outcome on Exchange B: Consuming 8.0 BTC at Level 1, 10.0 BTC at Level 2, and 2.0 BTC at Level 3 yields a total cost of $1,924,680, resulting in an effective average VWAP of $96,234.00.
The Comparison Verdict
Although Exchange A advertised a top-of-book price that was $70 cheaper ($96,150 vs. $96,220), buying the 20 BTC on Exchange B saved the trader $4,750 in pure cash ($1,924,680 vs. $1,929,430).
This is why institutional algorithmic trading desks never compare exchanges based on the first line of the order book.
Section 3: The Mechanics of Synthetic Consolidated Order Books
How do quantitative analytics platforms like LiveCryptoPrices construct a single, unified view of Bitcoin liquidity across disparate global venues?
The engine builds a Synthetic Consolidated Order Book (SCOB) by establishing simultaneous low-latency WebSocket connections to exchange matching engines across North America, Europe, and Asia. The pipeline executes five key steps in real time:
Section 4: Hidden Pitfalls When Comparing Bitcoin Exchange Prices
When performing live cross-exchange comparisons, active traders must watch out for four treacherous market microstructure traps:
1. The "Phantom Liquidity" & Spoofing Trap
Not all liquidity visible on an exchange order book is genuine. High-frequency algorithmic market makers place resting limit orders with automated sub-millisecond cancellation triggers. If an aggressive market order hits a competing exchange, market maker algorithms detect the latency footprint and cancel their resting quotes on other exchanges in less than 5 milliseconds.
What appeared to be 100 BTC of deep liquidity on your comparison screen suddenly evaporates right before your order arrives, forcing your transaction to fill at much worse prices.
2. Tiered VIP Fee Asymmetry
Exchange fee schedules are heavily tiered. A retail trader paying standard taker fees (0.40% to 0.60% on Coinbase or Kraken) faces a completely different execution hurdle than an institutional market maker with VIP 9 status paying negative maker rebates (-0.005%) or 0.02% taker fees on Binance or OKX.
A price comparison tool might show an attractive 0.30% spread between two venues, but if your account tier incurs 0.40% in round-trip taker fees, attempting to exploit that spread is mathematically guaranteed to lose capital.
3. Fiat Gateway Incompatibility & Deposit Holds
You spot Bitcoin trading at $95,000 on Exchange A and $96,200 on Exchange B. You rush to deposit $100,000 via ACH or wire transfer to Exchange A. However, Exchange A places a 5-day security hold on newly deposited fiat funds before allowing cryptocurrency withdrawals.
By the time your withdrawal lock clears 120 hours later, the market has completely shifted, the spread has inverted, and you are left holding unwanted exposure.
4. API Rate Limiting & WebSocket Latency Jitter
During extreme market volatility (such as CPI inflation data releases or major liquidation cascades), public exchange REST and WebSocket APIs experience heavy queuing and dropped packets. A price comparison feed displaying a 500ms delayed quote can mislead you into routing orders to obsolete liquidity that has already been cleared out by colocation servers.
Section 5: Step-by-Step Trader’s Blueprint: How to Compare & Execute Like a Pro
Whether you are executing a $5,000 swing trade or rebalancing a $500,000 spot portfolio, follow this institutional execution checklist before pulling the trigger:
Section 6: Cross-Exchange Divergence as a Market Direction Predictor
Beyond individual execution savings, comparing Bitcoin prices across different categories of exchanges provides immense macro and tactical forecasting value:
1. Spot-Led vs. Derivatives-Led Rallies
When spot exchange prices (Coinbase BTC/USD, Bitstamp BTC/USD) trade at a premium to offshore perpetual futures platforms (Binance BTC/USDT, Bybit), the rally is driven by real spot capital accumulation. Spot-led rallies are structurally durable and tend to sustain multi-week trends.
Conversely, when perpetual futures trade at an aggressive premium while spot books lag, the move is driven by leveraged speculation, creating high vulnerability to violent long squeeze flushes.
2. Asian vs. Western Trading Session Hand-offs
Comparing the relative price strength of Asian retail exchanges (Upbit, OKX, Binance Asia) during Tokyo/Singapore hours against Western institutional exchanges during New York hours reveals which geographic capital cohort is accumulating or distributing.
A persistent premium opening up during US hours that holds through the Asian session indicates aggressive global structural absorption of Bitcoin supply.
Conclusion: Precision Comparison is the Ultimate Edge
In modern cryptocurrency trading, price comparison across exchanges is not merely a utility for finding cheap coins—it is a foundational lens into global liquidity dynamics, institutional order flow, and structural market microstructure.
By moving beyond simplistic last-traded ticker prices, mastering depth-adjusted VWAP calculations, and utilizing real-time multi-exchange analytics like LiveCryptoPrices, you elevate your trading from blind guessing to institutional-grade execution excellence.