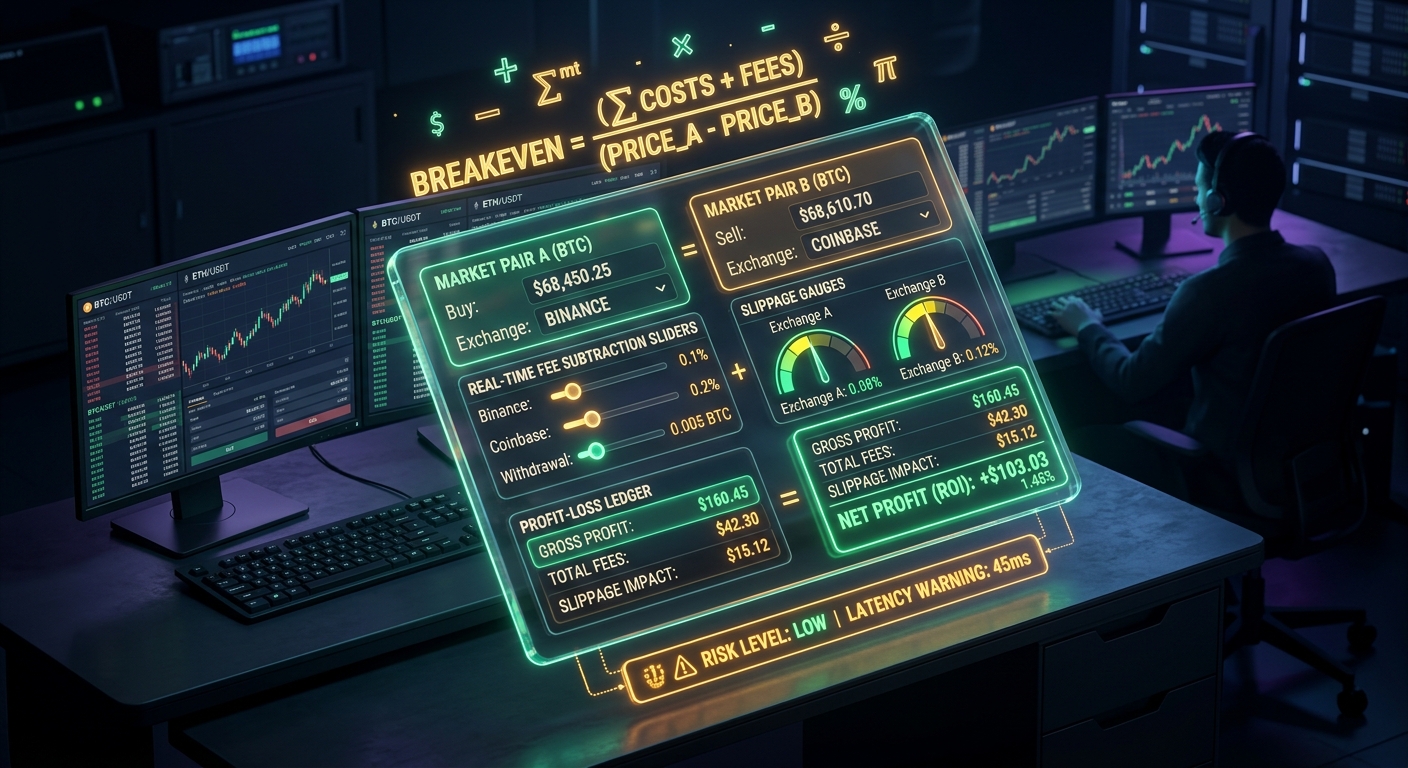
Every week, thousands of crypto traders spot what looks like "free money": Bitcoin is quoting $64,200 on Kraken and $65,100 on Binance—a staggering +$900 (+1.40%) price spread.
Excited by the prospect of an effortless $900 profit per Bitcoin, a trader buys on Kraken, sells on Binance, and eagerly awaits their net balance.
The shocking result? A net loss of -$74.12.
What happened? The trader fell into the classic Gross Spread Trap. They failed to account for the six hidden layers of friction that govern cross-exchange execution: maker/taker fee tiers, Level-2 order book depth slippage, stablecoin depeg drift, fiat wire clearance fees, and on-chain withdrawal gas.
In this tutorial, we will construct a production-ready Crypto Arbitrage Break-Even Calculator from first mathematical principles. You will learn the exact algebraic equations used by quantitative market makers, walk through Python and spreadsheet implementations, and discover how to automate the entire process using our interactive Arbitrage Profit Calculator.
1. The 6 Layers of Arbitrage Friction
Before writing a single line of math, we must map out every financial tollbooth that sits between your capital and your realized profit:
| Friction Layer | Symbol | Typical Range | Description & Microstructure Impact |
|---|---|---|---|
| 1. Buy-Side Taker Fee | $f_{\text{buy}}$ | 0.02% to 0.60% | Exchange transaction fee charged by Venue A to execute an immediate market buy against the resting ask book. |
| 2. Sell-Side Taker Fee | $f_{\text{sell}}$ | 0.02% to 0.60% | Exchange transaction fee charged by Venue B to execute an immediate market sell against the resting bid book. |
| 3. Buy-Side VWAP Slippage | $\delta_{\text{buy}}$ | 0.01% to 1.80% | The volume-weighted price increase incurred when sweeping through multiple price levels of the ask order book. |
| 4. Sell-Side VWAP Slippage | $\delta_{\text{sell}}$ | 0.01% to 1.80% | The volume-weighted price decrease incurred when sweeping through multiple price levels of the bid order book. |
| 5. Stablecoin / FX Friction | $\epsilon_{\text{fx}}$ | -0.10% to +0.25% | Price divergence between USDT, USDC, and pure USD fiat (e.g. USDT trading at $0.9985 or $1.0015). |
| 6. Fixed Gas / Network Fee | $C_{\text{fixed}}$ | $1.00 to $45.00 | Fixed on-chain gas costs for rebalancing balances across wallets or exchange withdrawal surcharges. |
2. The Master Break-Even Mathematical Framework
Let us derive the exact algebraic formula to determine the Break-Even Minimum Spread ($S_{\text{min}}$) required for a trade to yield zero profit and zero loss ($PnL = 0$).
Suppose you deploy capital $C$ (in USD or USDT) to buy asset $X$ on Exchange A at quoted price $P_A$, and simultaneously sell it on Exchange B at quoted price $P_B$.
Step 1: Realized Acquisition Cost (Venue A)
The actual effective buy price per unit ($P_{\text{buy, eff}}$) incorporating taker fees and volume-weighted slippage is:
P_{buy, eff} = P_A · (1 + \delta_{buy}) · (1 + f_{buy})The total quantity of asset $X$ acquired ($Q$) with capital $C$ is:
Q = (C) / (P_{buy, eff)} = (C) / (P_A · (1 + \delta_{buy)) · (1 + f_{buy})}Step 2: Realized Proceeds (Venue B)
Selling quantity $Q$ on Venue B at effective price ($P_{\text{sell, eff}}$) yields gross proceeds before fixed gas fees:
P_{sell, eff} = P_B · (1 - \delta_{sell}) · (1 - f_{sell}) · (1 - \epsilon_{fx})Gross Proceeds = Q · P_{sell, eff} = C · \frac{P_B · (1 - \delta_{sell}) · (1 - f_{sell}) · (1 - \epsilon_{fx})}{P_A · (1 + \delta_{buy}) · (1 + f_{buy})}Step 3: Setting Net Profit to Zero ($PnL = 0$)
Net profit equals Realized Proceeds minus Initial Capital $C$ minus Fixed Network Costs $C_{\text{fixed}}$:
Net Profit = Gross Proceeds - C - C_{fixed} = 0Solving for the required price ratio $\frac{P_B}{P_A}$ yields the Master Break-Even Hurdle Rate ($S_{\text{hurdle}}$):
S_{hurdle} = ≤ft( (P_B) / (P_A) - 1 \right)_{min} = \frac{(1 + \frac{C_{fixed}}{C}) · (1 + \delta_{buy}) · (1 + f_{buy})}{(1 - \delta_{sell}) · (1 - f_{sell}) · (1 - \epsilon_{fx})} - 13. Step-by-Step Implementation: Building the Engine
Here is the complete, production-grade calculation logic implemented in TypeScript and Python:
// Institutional Crypto Arbitrage Break-Even Engine
export interface BreakEvenParams {
  tradeCapitalUSD: number;      // e.g. $10,000
  buyTakerFeePct: number;       // e.g. 0.10% (0.0010)
  sellTakerFeePct: number;      // e.g. 0.075% (0.00075)
  buyBookSlippagePct: number;   // e.g. 0.08% (0.0008)
  sellBookSlippagePct: number;  // e.g. 0.06% (0.0006)
  stablecoinFxFrictionPct: number; // e.g. 0.02% (0.0002)
  fixedTransferCostUSD: number; // e.g. $5.00
}

export function calculateArbitrageBreakEven(params: BreakEvenParams) {
  const {
    tradeCapitalUSD, buyTakerFeePct, sellTakerFeePct,
    buyBookSlippagePct, sellBookSlippagePct,
    stablecoinFxFrictionPct, fixedTransferCostUSD
  } = params;

  // 1. Calculate fixed cost drag as a percentage of deployed capital
  const fixedCostDragPct = fixedTransferCostUSD / tradeCapitalUSD;

  // 2. Buy-side multiplier (costs that inflate acquisition price)
  const buySideMultiplier = (1 + fixedCostDragPct) * (1 + buyBookSlippagePct) * (1 + buyTakerFeePct);

  // 3. Sell-side multiplier (costs that deflate realized proceeds)
  const sellSideMultiplier = (1 - sellBookSlippagePct) * (1 - sellTakerFeePct) * (1 - stablecoinFxFrictionPct);

  // 4. Exact Minimum Gross Spread Required for 0% PnL
  const breakEvenGrossSpreadPct = (buySideMultiplier / sellSideMultiplier) - 1;

  return {
    breakEvenGrossSpreadPct: breakEvenGrossSpreadPct * 100, // e.g. +0.485%
    breakEvenGrossSpreadBps: breakEvenGrossSpreadPct * 10000, // e.g. 48.5 bps
    totalFrictionDollars: tradeCapitalUSD * breakEvenGrossSpreadPct,
  };
}
4. Forensic Case Studies: Live Trade Simulations
Let us run three realistic scenarios through our mathematical framework to see how trade size and exchange selection drastically alter the break-even hurdle rate:
Case Study A: The Small Retail Trader ($500 Capital on SOL)
Case Study B: The Mid-Size Desk ($25,000 Capital on ETH)
Case Study C: The Institutional Prop Desk ($100,000 Capital on BTC)
5. Why an Interactive Real-Time Calculator Beats Static Spreadsheets
While building a spreadsheet is a fantastic educational exercise, live crypto markets move in milliseconds: