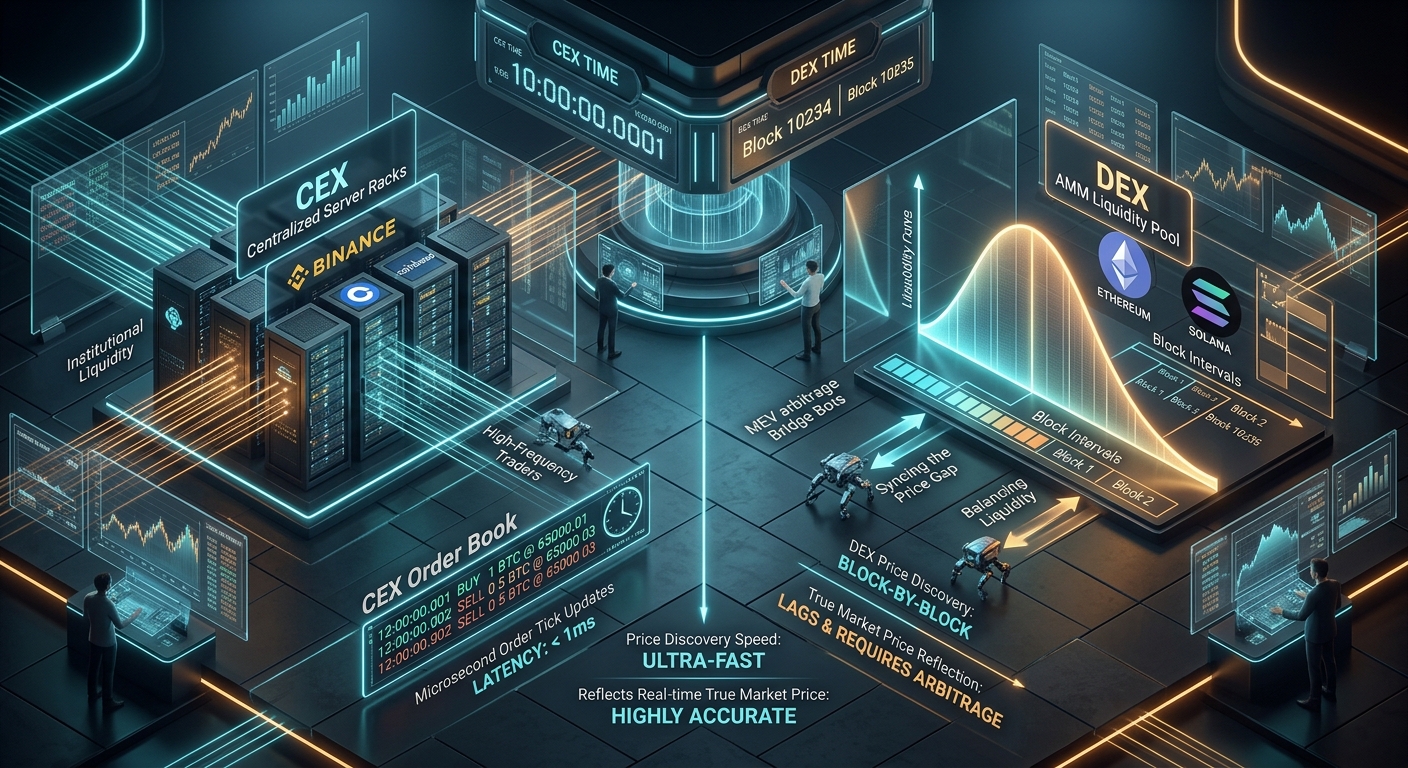
Imagine two clocks sitting on a trading desk:
Clock A ticks every 200 microseconds, powered by ultra-low-latency fiber optic lines connected directly to server racks in Virginia and Frankfurt.
Clock B ticks every 12 seconds, powered by a decentralized consensus network spread across ten thousand independent validators across six continents.
If a high-impact news event occurs—say, the Federal Reserve announces an emergency interest rate cut—which clock will show the correct time first?
This is the fundamental dilemma at the heart of modern cryptocurrency market microstructure: Centralized Exchanges (CEXs like Binance, Coinbase, and Kraken) versus Decentralized Exchanges (DEXs like Uniswap, Raydium, and Curve).
Traders frequently ask: Which platform displays the "true" market price of an asset? Which venue discovers price changes first? And why does a token often trade at two different prices simultaneously across CEX and DEX order books?
In this forensic architectural guide, we dissect how price discovery works on both architectures, explain the role of MEV arbitrage bots in bridging the price gap, and explore the surprising market conditions where decentralized liquidity pools actually lead centralized giants.
1. The Architectural Divide: CLOB vs. AMM
To understand why CEXs and DEXs move at different speeds, we must look at how their matching engines are built.
[ CEX CLOB vs. DEX AMM ARCHITECTURE ]

  CENTRALIZED EXCHANGE (CEX)                  DECENTRALIZED EXCHANGE (DEX)
  (e.g., Binance, Coinbase)                   (e.g., Uniswap v3, Raydium)
  ┌──────────────────────────────┐            ┌──────────────────────────────┐
  │ Architecture: Central Limit  │            │ Architecture: Automated      │
  │               Order Book     │            │               Market Maker   │
  │ Engine:       In-Memory C++  │            │ Engine:       Deterministic  │
  │ Matching:     Continuous     │            │               Smart Contract │
  │ Latency:      <500 Microsecs │            │ Latency:      12s (ETH)      │
  │ Updates:      Millions / sec │            │               400ms (SOL)    │
  └──────────────────────────────┘            └──────────────────────────────┘
Centralized Limit Order Books (CLOB)
On Binance or Coinbase, buyers and sellers post discrete bids and asks. The exchange operates a private, high-frequency in-memory matching engine written in optimized C++ or Rust.
When market makers adjust quotes based on global macro news, they cancel and replace orders in sub-millisecond timeframes. There is no blockchain transaction fee, no mempool queue, and no block delay.
Automated Market Makers (AMM)
A DEX like Uniswap has no central matching server. Instead, prices are determined by mathematical deterministic invariant curves, such as the constant product formula:
[ CONSTANT PRODUCT AMM FORMULA ]

  x · y = k

  Where:
    • x = Reserve balance of Token A (e.g., ETH)
    • y = Reserve balance of Token B (e.g., USDC)
    • k = Invariant constant liquidity product
    • Current Marginal Price = y / x
Crucially, an AMM pool cannot update its own price. It has no eyes, no internet connection, and no API connection to external markets. It remains completely static at its old price until an external trader sends an on-chain transaction to buy or sell from the pool.
2. The Mechanics of Price Propagation: How CEX Leads DEX
For major liquid cryptocurrencies (such as BTC, ETH, and SOL), centralized exchanges lead price discovery more than 98% of the time.
Here is the exact step-by-step sequence of how a price change propagates from CEX to DEX:
[ THE SUB-SECOND PRICE PROPAGATION TIMELINE ]

  T = 0.000s: High-impact US CPI inflation report releases.
  T + 0.002s: HFT algorithms on Binance & Coinbase adjust bids, pushing ETH from $3,500 to $3,550.
  T + 0.005s: Uniswap v3 ETH/USDC pool on Ethereum is still sitting at $3,500 (STALE POOL STATE).
  T + 0.100s: MEV Searcher Bots simulate arbitrage transactions: Buy ETH on Uniswap at $3,500,
              hedge by selling ETH on Binance at $3,550.
  T + 0.200s: Searcher bots submit private Flashbots bundles, bidding 90% of the $50 profit to the block builder.
  T + 12.00s: Next Ethereum block is finalized. The top transaction in the block executes the swap,
              rebalancing the Uniswap pool to $3,550.
Between T = 0.002s and T = 12.00s, the DEX price was objectively inaccurate and stale.
Decentralized exchanges on Layer-1 blockchains are structurally constrained by Block Time Latency. Even on ultra-fast chains like Solana (~400ms slots) or Arbitrum (~250ms blocks), centralized order books with fiber-optic cross-connects react orders of magnitude faster.
3. The Cost of Stale DEX Prices: Loss Versus Rebalancing (LVR)
Because CEX prices move first, DEX liquidity providers (LPs) face a permanent mathematical cost called Loss Versus Rebalancing (LVR).
When an external asset price changes on Binance, the Uniswap liquidity pool becomes an "underpriced stale store".
Arbitrage bots immediately buy the discounted asset from the pool before ordinary retail traders even realize the price has moved. This means DEX liquidity providers are always on the losing side of informed order flow—they sell too cheap when prices rise, and buy too expensive when prices fall.
[ LVR: THE ARBITRAGEUR EXTRACTIVE DRAIN ]

  External Market Price (CEX):   $3,550  (Informed Real-World Value)
  Un-arbitraged DEX Pool:         $3,500  (Stale Pool Quote)
  ─────────────────────────────────────────────────────────────────
  Arbitrageur Action:             Swaps $3,500 USDC for 1.0 ETH from LP
  Arbitrageur Profit:            +$50.00 (Instant Risk-Free Extraction)
  DEX Liquidity Provider Loss:   -$50.00 (Opportunity Loss = LVR)
Quantitative studies show that LVR costs decentralized liquidity providers hundreds of millions of dollars annually, proving that DEX prices are reactive rather than predictive for major assets.
4. The 3 Rare Scenarios Where DEXs Lead CEXs
While CEXs dominate macro assets, there are three distinct market regimes where DEXs reflect the "true" market price significantly faster than centralized exchanges:
[ WHERE DEX PRICES BEAT CEX PRICES ]

  1. NEW TOKEN LAUNCHES & MEMECOINS (100% on-chain liquidity; CEXs don't list them for weeks).
  2. PROTOCOL EXPLOITS & GOVERNANCE HACKS (Smart contract drained on-chain before CEX notices).
  3. CEX DEPOSIT FREEZES & BANK RUNS (e.g. USDC Depeg Weekend / FTX Insolvency).
1. Long-Tail Token Launches & Memecoins
When a new project launches on Ethereum or Solana, it exists exclusively on DEX liquidity pools (such as Uniswap or Raydium).
Centralized exchanges require lengthy compliance reviews, technical integration, and listing fees. For the first days or weeks of a token’s life, 100% of organic price discovery happens on DEXs.
When a CEX finally lists the token, its initial listing price is merely a derivative copy of the prevailing DEX pool price.
2. Real-Time On-Chain Exploits
When a DeFi protocol suffers a smart contract exploit, the attacker swaps the stolen collateral on a DEX in the exact same transaction block as the hack.
The token’s price on Uniswap crashes to zero in one block.
Meanwhile, centralized exchanges often take 15 to 45 minutes for risk management teams to manually notice the exploit, investigate social media reports, and halt trading or deposits.
3. Banking Rail Disconnections & CEX Deposit Freezes (The March 2023 USDC Case Study)
When Silicon Valley Bank collapsed over a weekend in March 2023, Circle revealed it had $3.3 billion held at the failed bank.
Traditional US banking wires (Fedwire/ACH) were closed for the weekend. Centralized exchanges like Coinbase temporarily suspended 1:1 USD-to-USDC conversions.
Where did the world turn to discover the real-time clearing price of USDC?
The Curve 3pool on Ethereum.
Traders deposited billions of dollars of USDC into the automated Curve pool to exit into USDT and DAI. The Curve pool balance skewed to 95% USDC, transparently driving the price down to $0.88 in real time.
Because CEX banking rails were halted, the decentralized automated market maker was the only venue on Earth providing live, un-halted price discovery.
5. Architectural Comparison: CEX vs. DEX Price Discovery
| Dimension | Centralized Exchange (CEX) | Decentralized Exchange (DEX) |
|---|---|---|
| Price Discovery Speed | Sub-millisecond (Microseconds) | Block-time limited (400ms to 12s) |
| Mechanism | Central Limit Order Book (Bids & Asks) | Automated Invariant Curve ($x · y = k$) |
| Market Driver | Active market maker quote updates | Passive pool rebalanced by MEV arbitrageurs |
| Transparency | Black-box internal database | 100% public, verifiable on-chain state |
| Custodial Risk | High (Exchange holds private keys) | Zero (Non-custodial, self-custody wallet) |
| Trading Halt Risk | High (Exchanges can freeze trading/withdrawals) | Zero (Smart contracts cannot be paused by CEO) |
| Price Manipulation Vector | Internal spoofing / wash trading | Sandwich attacks / MEV front-running |
6. Quantitative Takeaways & Execution Checklist
When building trading systems or executing large cryptocurrency orders, remember these foundational principles: