Picture this scenario: you are monitoring live crypto markets, and your scanner flags a glaring discrepancy. Solana is trading at $180.00 on Exchange A and $182.50 on Exchange B. That is a $2.50 per coin gross spread (+1.388%).
With $20,000 ready to deploy, the napkin math looks irresistible: buy ~111 SOL on Exchange A, sell on Exchange B, and pocket $277.70 in risk-free profit in five minutes. You execute the trades.
When your balances settle and you check your P&L, you are shocked to see a -$42.15 loss. Where did the $277 profit vanish? It evaporated into the invisible friction of exchange taker fees, flat withdrawal gas penalties, order book sweep slippage, and price latency decay.
This painful realization is why professional quantitative trading desks never touch a spatial or cross-venue trade without running it through a Crypto Arbitrage Calculator.
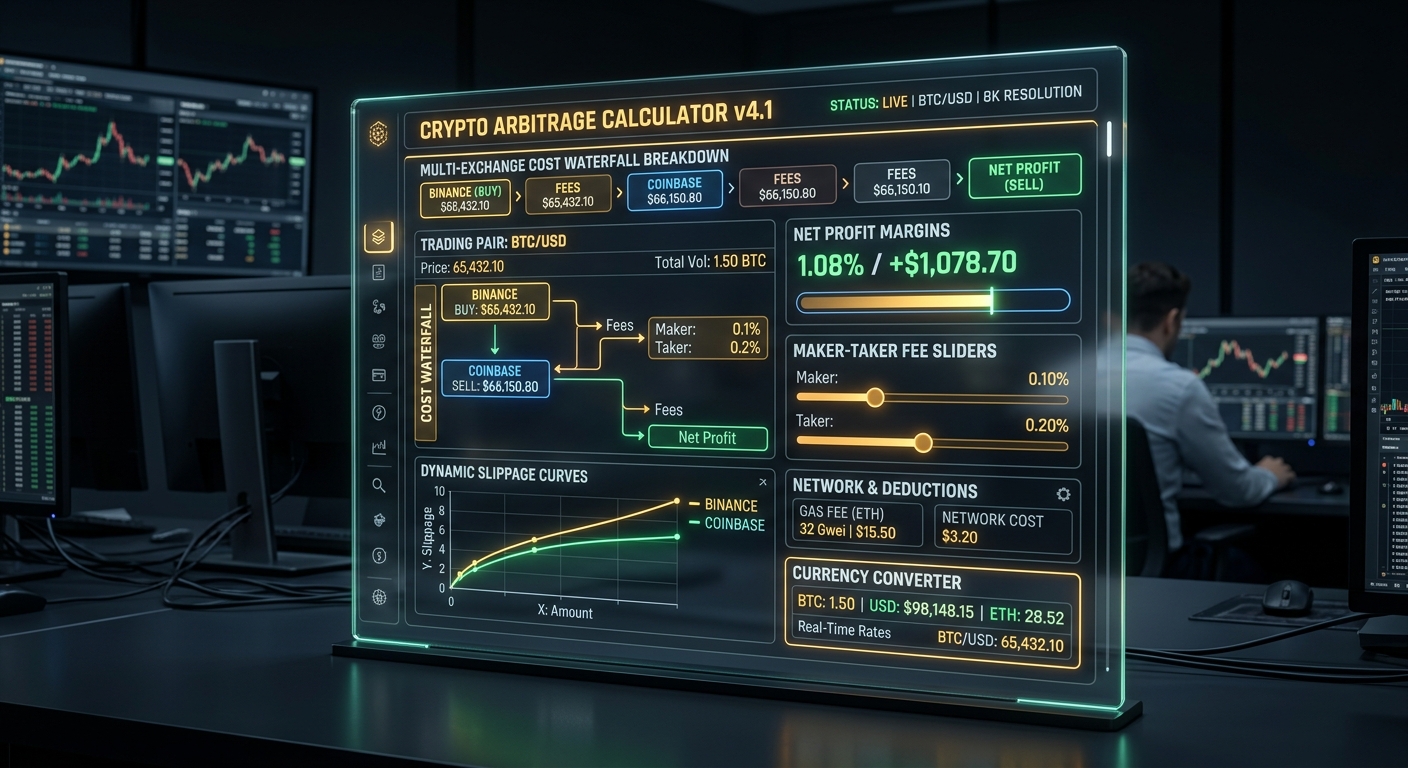
In digital asset trading, an arbitrage calculator is not a basic subtraction tool—it is a sophisticated mathematical simulation model that maps the entire execution cost waterfall, determines non-linear breakeven thresholds, and computes real-world Net Return on Investment (Net ROI). Let us break down how the math actually works.
Section 1: Anatomy of the Four-Tier Cost Waterfall
To understand why gross price differences fail to translate into net profits, you must inspect the four friction layers that every physical or algorithmic arbitrage trade must survive.
Tier 1: Two-Leg Exchange Trading Fees (Maker vs. Taker)
Arbitrage requires two distinct transactions: buying on Venue A and selling on Venue B. Unless you are an institutional market maker with VIP 9 negative rebates, you will pay standard taker fees on both legs:
If both exchanges charge a standard 0.25% retail taker fee, your trade immediately incurs 0.50% in round-trip transaction costs before factoring in transfers or slippage.
Tier 2: Order Book Depth & Multi-Tier Slippage
Top-of-book prices only apply to the few coins sitting at the very peak of the order book ladder. When deploying meaningful capital, your market order consumes multiple price tiers:
Slippage Cost = Filled_VWAP - Top_of_Book_PriceIf your $20,000 buy order pushes the average ask price up by 0.25% on Exchange A, and your sell order depresses the bid price by 0.30% on Exchange B, you lose 0.55% of your gross spread to depth slippage alone.
Tier 3: On-Chain Blockchain Withdrawal & Gas Fees
If you are transferring capital sequentially across venues (Sequential Transfer Model), centralized exchanges charge flat withdrawal fees regardless of transfer size:
Notice the critical mathematical asymmetry: fixed fees heavily punish small trade sizes. A $20 flat withdrawal fee on a $500 trade consumes 4.0% of your capital, making small-scale sequential arbitrage mathematically impossible.
Tier 4: Execution Latency & Opportunity Cost Decay
During the time it takes for a blockchain transaction to confirm (10 minutes on Bitcoin, 15 seconds on Ethereum, 400 milliseconds on Solana), market prices continue to fluctuate. If the market trends against your unhedged inventory during transit, your spread can flip from positive to deeply negative before you can hit the sell button.
Section 2: The Core Mathematical Formulas of an Arbitrage Calculator
How does a professional calculator compute executable net profit? Here is the exact algorithmic pipeline executed by the LiveCryptoPrices engine:
1. Gross Spread Calculation
Gross Spread ($) = Sell_Price - Buy_PriceGross Spread (%) = ((Sell_Price - Buy_Price) / Buy_Price) * 1002. Coins Acquired After Buy Fee
Coins_Bought = (Initial_Capital * (1 - Taker_Fee_Buy)) / Buy_Price3. Coins Remaining After On-Chain Withdrawal
Coins_Arrived = Coins_Bought - Flat_Withdrawal_Fee_In_Crypto4. Gross Sell Revenue After Slippage
Effective_Sell_Price = Sell_Price * (1 - Estimated_Sell_Slippage)Gross_Revenue = Coins_Arrived * Effective_Sell_Price5. Net Capital After Sell Fee
Net_Final_Capital = Gross_Revenue * (1 - Taker_Fee_Sell)6. Net Realized Profit and ROI
Net Profit ($) = Net_Final_Capital - Initial_CapitalNet ROI (%) = (Net Profit / Initial_Capital) * 1007. The Universal Breakeven Spread Formula
Breakeven Spread (%) ≈ Taker_Fee_Buy (%) + Taker_Fee_Sell (%) + Slippage (%) + ((Fixed_Withdrawal_Fee_USD / Initial_Capital) * 100)This formula yields the single most important metric for any trader: the absolute minimum gross price gap required before a trade produces a single cent of real profit.
Section 3: Step-by-Step Practical Simulation: A Real-World Comparison
Let us run two real-world capital allocations through the calculator to demonstrate how scale and fee structures dictate viability.
Market Scenario: Ethereum (ETH) is trading at $3,400 on Exchange A and $3,440 on Exchange B (+1.176% Gross Spread).
Parameters: Exchange A Taker = 0.20%, Exchange B Taker = 0.20%, Estimated Depth Slippage = 0.15%, Flat ETH Withdrawal Fee = 0.003 ETH ($10.20).
Case A: Retail Trader with $1,000 Capital
Outcome for $1,000 Capital: Net Profit = -$4.08 (-0.41% ROI). Even with a seemingly healthy 1.18% gross spread, the retail trader lost money because the $10.20 fixed gas fee consumed 1.02% of total capital.
Case B: Quantitative Trader with $50,000 Capital
Outcome for $50,000 Capital: Net Profit = +$301.63 (+0.603% ROI). The fixed $10.20 withdrawal fee diluted to a negligible 0.02% of capital, allowing the trader to capture a clean $301 profit.
This side-by-side comparison reveals why inputting your exact capital size into an arbitrage calculator is essential before committing capital.
Section 4: Advanced Calculator Modeling: Pre-Funded vs. Triangular Arbitrage
Modern arbitrage calculators accommodate different execution architectures that bypass on-chain transfer fees entirely:
1. The Pre-Funded Dual-Balance Model
In a pre-funded model, the trader maintains capital on both venues simultaneously (e.g., $25,000 USDT on Exchange A and 7.5 BTC on Exchange B).
When an arbitrage opportunity appears, the calculator sets Flat_Withdrawal_Fee = 0 and eliminates transit latency. The trade executes simultaneously via dual API calls. The calculator focuses purely on: Net Spread = Gross Spread - (Taker_A + Taker_B + Combined_Slippage).
2. Triangular Intra-Exchange Arbitrage Modeling
For triangular trades (e.g., USDT -> BTC -> ETH -> USDT on a single exchange), the calculator models three consecutive trading fees with zero withdrawal friction:
Multiplier = (1 - Fee_1) * (1 - Fee_2) * (1 - Fee_3) ≈ 1 - (3 * Taker_Fee)If an exchange charges 0.075% (using native fee token discounts like BNB on Binance), total three-leg friction is only 0.225%. Any triangular price cycle yielding >0.25% represents net profit.
Section 5: Real-World Case Studies in Arbitrage Calculation Errors
Examining historical trading failures highlights why accurate calculator simulation is critical:
Case Study 1: The Korean Won (KRW) Currency Conversion Illusion (2021)
During the 2021 bull market, Bitcoin traded on South Korean exchanges (Upbit, Bithumb) at a 12% Kimchi Premium. An independent trader spotted BTC at $55,000 on Binance and $61,600 on Upbit.
Failing to factor in international wire conversion spreads (USD to KRW foreign exchange markups of 1.5%), domestic Korean banking compliance fees, and the 3-day SWIFT repatriation turnaround, the trader sent capital overseas. By the time fiat returned to the US account, foreign exchange slippage and market retracement converted an expected $6,600 gain into an $1,800 net loss.
Case Study 2: The Illiquid Micro-Cap Depth Sweep (2023)
A trader observed a newly listed decentralized token trading at $1.20 on Uniswap and $1.45 on Gate.io (+20.8% spread). Using a basic spreadsheet calculator without order book depth modeling, the trader bought $10,000 worth on Uniswap and sent it to Gate.io.
Upon arrival, Gate.io’s order book had only $300 of bids at $1.45. The next bid rung was $1.10. Dumping the $10,000 position caused 25% negative slippage, completely wiping out the spread. A depth-aware arbitrage calculator would have instantly flagged the trade as unexecutable.
Section 6: Actionable Playbook: How to Use the Live Arbitrage Calculator
Follow this four-step institutional workflow whenever analyzing potential cross-exchange trades:
Conclusion: Replace Guesswork with Mathematical Precision
In the fast-moving, fragmented cryptocurrency markets, gross price differences offer tempting promises that market friction routinely breaks. A comprehensive Crypto Arbitrage Calculator bridges the gap between theoretical spreads and realized bankable profits.
By systematically accounting for two-leg trading fees, order book depth slippage, on-chain transfer gas, and capital size dynamics, you eliminate costly surprises, protect your trading capital, and execute with quantitative confidence.