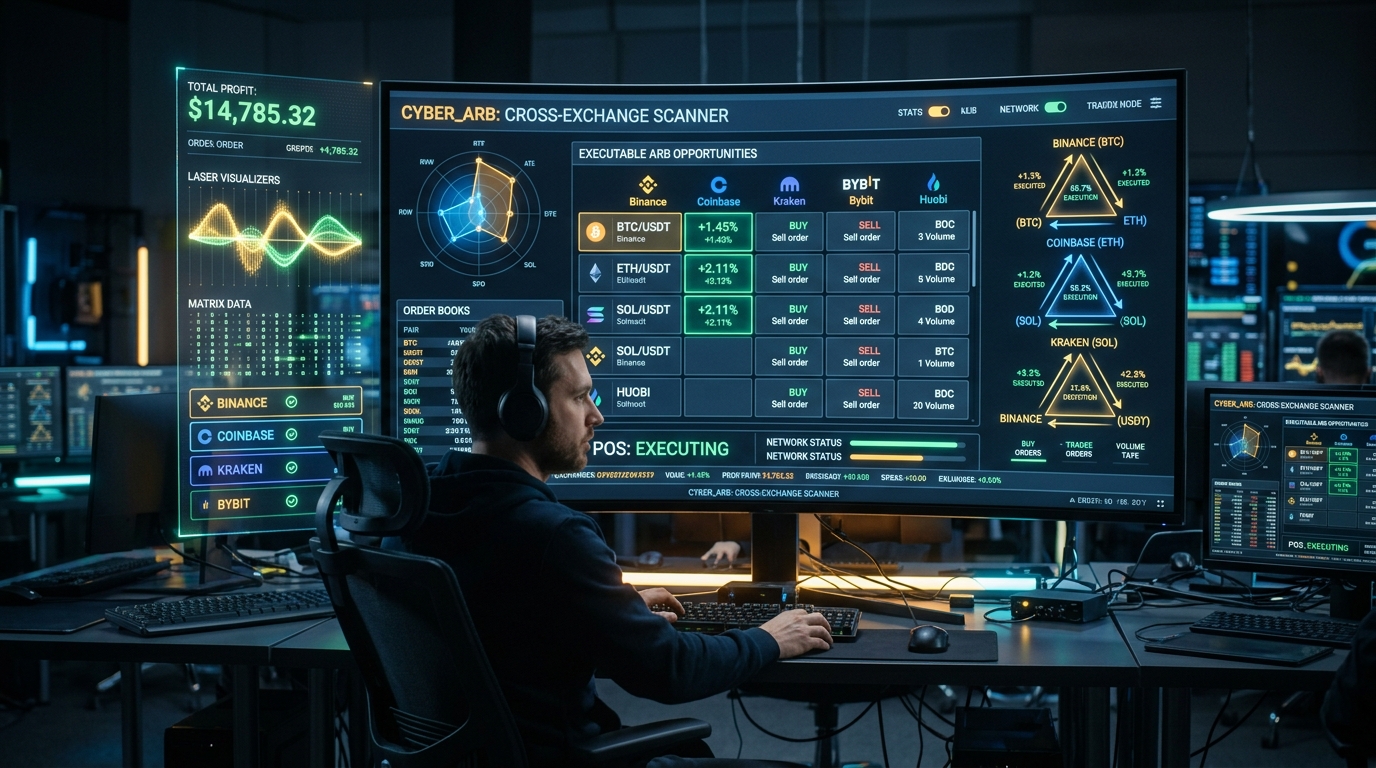
In a 24/7 global cryptocurrency ecosystem spanning more than 600 centralized exchanges, thousands of decentralized liquidity pools, and over 20,000 listed token pairs, billions of dollars in price discrepancies flicker into existence every single day.
A sudden $10 million market sell order on Kraken drops Solana to $178.40, while Binance trades at $181.10. An algorithmic rebalance on Uniswap v3 leaves Ethereum priced $25 cheaper than Coinbase for 400 milliseconds. A newly listed altcoin experiences a 4% triangular pricing dislocation across BTC, ETH, and USDT trading pairs on OKX.
To an unassisted human trader gazing at static browser tabs, these micro-opportunities are invisible. But to a high-speed crypto arbitrage scanner, the global market is a dynamic, pulsating multidimensional graph where every momentary price inefficiency is mapped, measured, and evaluated in real time.
What is a crypto arbitrage scanner? How do these algorithms process millions of WebSocket updates per second to pinpoint executable alpha? And how can modern crypto traders use scanning engines to capture risk-managed yields while avoiding deceptive liquidity traps? Let us dive deep under the hood.
Section 1: The Core Architecture of a Crypto Arbitrage Scanner
At its architectural core, a crypto arbitrage scanner is not a glorified spreadsheet—it is a specialized, event-driven quantitative data pipeline designed to solve complex graph optimization problems at extreme speeds.
The scanning pipeline operates across four high-performance tiers:
Section 2: The Three Types of Arbitrage Scanned
Modern arbitrage scanning engines are engineered to identify three distinct classes of market inefficiencies:
1. Spatial (Cross-Exchange) Arbitrage
Spatial arbitrage occurs when an identical asset trades at different prices on two geographically or structurally separate exchanges at the exact same moment.
Example: Bitcoin is trading at $96,100 (Ask) on Exchange A, while Exchange B is bidding $96,480 (Bid).
The scanner monitors: Gross Spread = Bid(Exchange_B) - Ask(Exchange_A). It instantly computes whether the $380 gross spread exceeds the combined taker fees of both platforms (e.g., 0.10% on Venue A = $96.10, 0.10% on Venue B = $96.48) and the transfer cost.
2. Triangular (Intra-Exchange) Arbitrage
Triangular arbitrage exploits pricing inconsistencies between three related pairs on the exact same exchange, eliminating cross-venue blockchain transfer and counterparty risk entirely.
Consider the trio: USDT -> BTC -> ETH -> USDT on Binance:
Gross Profit: +$84.46 (+0.844%). Because all three trades occur on the same matching engine, capital never leaves the exchange. Scanners calculate these 3-node permutations continuously across hundreds of cross-pairs.
3. Cross-Venue (CEX vs. DEX) Arbitrage
Automated Market Makers (AMMs) on decentralized exchanges (such as Uniswap, Curve, and Raydium) rely on deterministic mathematical pricing formulas (like x * y = k or concentrated liquidity ticks) rather than central limit order books. Prices on AMMs update only when a transaction is confirmed on the blockchain.
When the price of ETH violently moves on centralized exchanges like Binance, the DEX pool price remains temporarily stale until an arbitrageur rebalances the pool. CEX-DEX scanners monitor the mempool and pending block proposals, comparing off-chain order books against on-chain liquidity curves to identify arbitrage spreads.
Section 3: The Mathematical Engine Behind Triangular Scanners (Bellman-Ford Algorithm)
How does a scanner evaluate thousands of possible triangular and multi-leg trading paths every millisecond without crashing under computational complexity?
Production scanners model the exchange as a Directed Currency Graph and apply the Bellman-Ford Algorithm.
The Mathematical Transformation
In a currency graph, we want to find a cycle where the product of exchange rates along the path is greater than 1:
R_1 R_2 R_3 ... R_k > 1 (Profitable Arbitrage)
Standard shortest-path graph algorithms (like Dijkstra or Bellman-Ford) find minimum sums, not maximum products. To convert product multiplication into additive summation, the scanner applies a negative natural logarithm transformation to every edge weight:
Weight = -ln(Exchange_Rate)Because ln(a * b) = ln(a) + ln(b), the arbitrage condition transforms mathematically into:
-ln(R_1 R_2 ... * R_k) < 0 => -ln(R_1) - ln(R_2) - ... - ln(R_k) < 0
Finding a profitable arbitrage opportunity is mathematically equivalent to detecting a Negative Cycle in a weighted directed graph! The Bellman-Ford algorithm detects negative cycles in O(V * E) time complexity, allowing the scanner to evaluate thousands of currency combinations in just a few CPU clock cycles.
Section 4: Deceptive Spreads: Why 90% of Scanner "Opportunities" Are Traps
If you build or use a basic arbitrage scanner, you will constantly see sensational spreads: "+4.8% on Token X between Exchange A and Exchange B!"
Why do experienced quantitative traders ignore these flags? Because amateur scanners fail to account for the Four Pillars of False Arbitrage:
1. The Closed Wallet / Suspended Withdrawal Trap
Whenever a token trades at a 3%+ spread between two centralized exchanges, in 99% of cases, wallet deposits or withdrawals are disabled on one of the venues. This happens during blockchain hard forks, wallet maintenance, network congestion, or token contract migrations. The spread is a trapped local market, not free money.
2. The Order Book Depth Mirage (Size Slippage)
A scanner flags a +2.0% spread on a low-cap altcoin. However, the top bid on Exchange B only has $85 worth of resting volume. The next bid down is 3.5% lower. If you execute a $2,000 order, your average filled price slips catastrophically into a net loss.
3. Taker Fee Erosion & Tier Disadvantages
A 0.45% gross spread looks profitable on a basic dashboard. But executing a spatial trade requires paying two taker fees (e.g., 0.20% on Exchange A + 0.20% on Exchange B = 0.40%). Factor in a $15 on-chain gas fee or token withdrawal fee, and the trade yields a negative return.
4. Latency Decay & Front-Running MEV Bots
In CEX-DEX arbitrage, Maximal Extractable Value (MEV) searchers run specialized Rust algorithms co-located with Ethereum and Solana validators. By the time a web-based scanner alerts you to a DEX price discrepancy, an MEV searcher has already bundled and executed the arbitrage transaction in the very next block.
Section 5: Real-World Case Studies in Arbitrage Scanning
To understand how arbitrage scanners operate during volatile market conditions, examine these real-world scenarios:
Case Study 1: The LUNA Collapse Cross-Exchange De-Peg (May 2022)
During the collapse of the Terra ecosystem in May 2022, UST and LUNA were minting and crashing at hyper-inflationary speeds. Centralized exchange order books completely de-synced from on-chain decentralized liquidity pools. Scanners detected unprecedented 20% to 50% spreads between Binance, KuCoin, and Terra Station.
High-speed quantitative desks with pre-funded capital and active on-chain relayers captured millions in delta-neutral profits in hours, while retail traders attempting manual cross-exchange transfers were wiped out when blockchain transactions took hours to confirm.
Case Study 2: The Pyth Network Cross-Venue Oracle Dislocation
When a fast-moving altcoin suddenly rallies on Binance, decentralized oracles (like Chainlink and Pyth) take several seconds to aggregate and push new on-chain price feeds. Sophisticated DEX arbitrage scanners detect the CEX momentum lead, instantly buying underpriced perpetual futures or synthetic assets on decentralized derivatives platforms (like GMX or dYdX) before the on-chain oracle updates the benchmark price.
Section 6: How Modern Crypto Traders Use Arbitrage Scanners for Alpha
Even if you are not operating automated algorithmic execution bots, an institutional-grade crypto arbitrage scanner like the one built into LiveCryptoPrices is an indispensable tool for active traders:
1. Real-Time Volatility Radar
A sudden spike in the number and magnitude of cross-exchange arbitrage alerts is the single earliest warning sign of impending market-wide volatility. When arbitrage scanners light up with positive spreads across major pairs, it signals aggressive institutional order flow entering the market before prices complete their broader macro breakout.
2. Best-Execution Smart Order Routing
Before entering any large spot or swing position, scanning cross-exchange depth ladders ensures you route your purchase to the venue with the lowest executable VWAP, instantly saving hundreds or thousands of dollars in execution drag.
3. Perpetual Funding Rate Harvest Scanner
Derivative arbitrage scanners track real-time 8-hour funding rates across Binance, Bybit, OKX, and dYdX. When an altcoin’s funding rate surges to +0.10% per 8 hours (+109.5% annualized), traders buy spot crypto and short the perpetual contract, scanning for the highest yield spread across platforms.
Conclusion: Turning Market Chaos into Algorithmic Clarity
In a fragmented, decentralized financial ecosystem, price discrepancies are an inevitable feature of market microstructure. A crypto arbitrage scanner is the ultimate instrument for navigating this fragmentation—transforming chaotic price disparities into structured, actionable intelligence.
By looking past superficial top-of-book mirages, respecting the mathematics of the cost waterfall, and leveraging real-time multi-exchange scanning engines, crypto traders can elevate their market awareness, protect their capital from slippage, and capture authentic execution alpha.