Imagine walking into an auction to buy a rare painting. The auctioneer announces that $100 million worth of art was traded in the room yesterday. Reassured by this massive "volume", you place a bid for $50,000, only to discover that there is currently only one seller in the room—and their minimum asking price is $75,000.
In the cryptocurrency world, this exact scenario happens millions of times every day. Traders look at an exchange dashboard, see "$500,000,000 Daily Volume", assume the asset is liquid, and hit "Market Buy"—only to suffer severe price slippage because the Order Book Liquidity was paper-thin.
Volume tells you what happened in the past. Liquidity tells you what you can execute right now.
Understanding cryptocurrency order book liquidity is the single most important skill separating amateur retail traders from quantitative professionals. Liquidity dictates whether your trade gets filled at fair value, whether an arbitrage opportunity is actually executable, and whether a sudden market sell-off will cascade into a catastrophic flash crash.
In this comprehensive guide, we demystify the inner mechanics of crypto order book liquidity, dissect Level-1 through Level-3 order data, expose the truth about fake bid/ask walls, walk through four unique numerical case studies, and provide an actionable framework for assessing true market depth.
What is Crypto Order Book Liquidity?
At its core, liquidity is the ease with which an asset can be converted into cash (or another asset) quickly, in significant volume, and with minimal impact on its market price.
In centralized cryptocurrency exchanges (and hybrid on-chain order books like Hyperliquid or dYdX), liquidity is organized into a Central Limit Order Book (CLOB). A CLOB is a real-time, double-auction electronic ledger that continuously pairs resting buy limit orders (Bids) with resting sell limit orders (Asks).
The Three Levels of Order Book Data
To understand liquidity depth, market data providers classify order books into three discrete tiers:
The Key Metrics of True Order Book Liquidity
Do not rely solely on exchange 24-hour volume figures. Quantitative desks evaluate liquidity through four rigorous microstructure metrics:
1. The Bid-Ask Spread
The nominal or percentage gap between the best bid and best ask:
Spread (%) = ((Best Ask - Best Bid) / Best Ask) × 100A tight spread (e.g. 0.01% on BTC/USDT on Binance) indicates intense market maker competition. A wide spread (e.g. 0.85% on an illiquid altcoin) signals sparse market making and high immediate friction.
2. ±1% and ±2% Market Depth
This metric measures the total cumulative dollar value of resting limit orders within 1% or 2% of the mid-market price. If an exchange has $10,000,000 in +2% ask depth, a trader could execute a $5,000,000 market buy without moving the price by more than 1%.
3. Market Depth Asymmetry (Bid-Ask Imbalance)
The ratio of cumulative bid volume to cumulative ask volume within a designated price band:
Order Book Imbalance = (Cumulative Bids - Cumulative Asks) / (Cumulative Bids + Cumulative Asks)A strongly positive ratio indicates heavy downside buying support, while a negative ratio suggests heavy overhead selling resistance.
4. Order Book Turnover & Replenishment Rate
How quickly market makers inject fresh limit orders after a large market order sweeps through resting liquidity. A book that replenishes within 50 milliseconds is resilient; a book that remains depleted for seconds is fragile.
The Phenomenon of Bid and Ask "Walls"
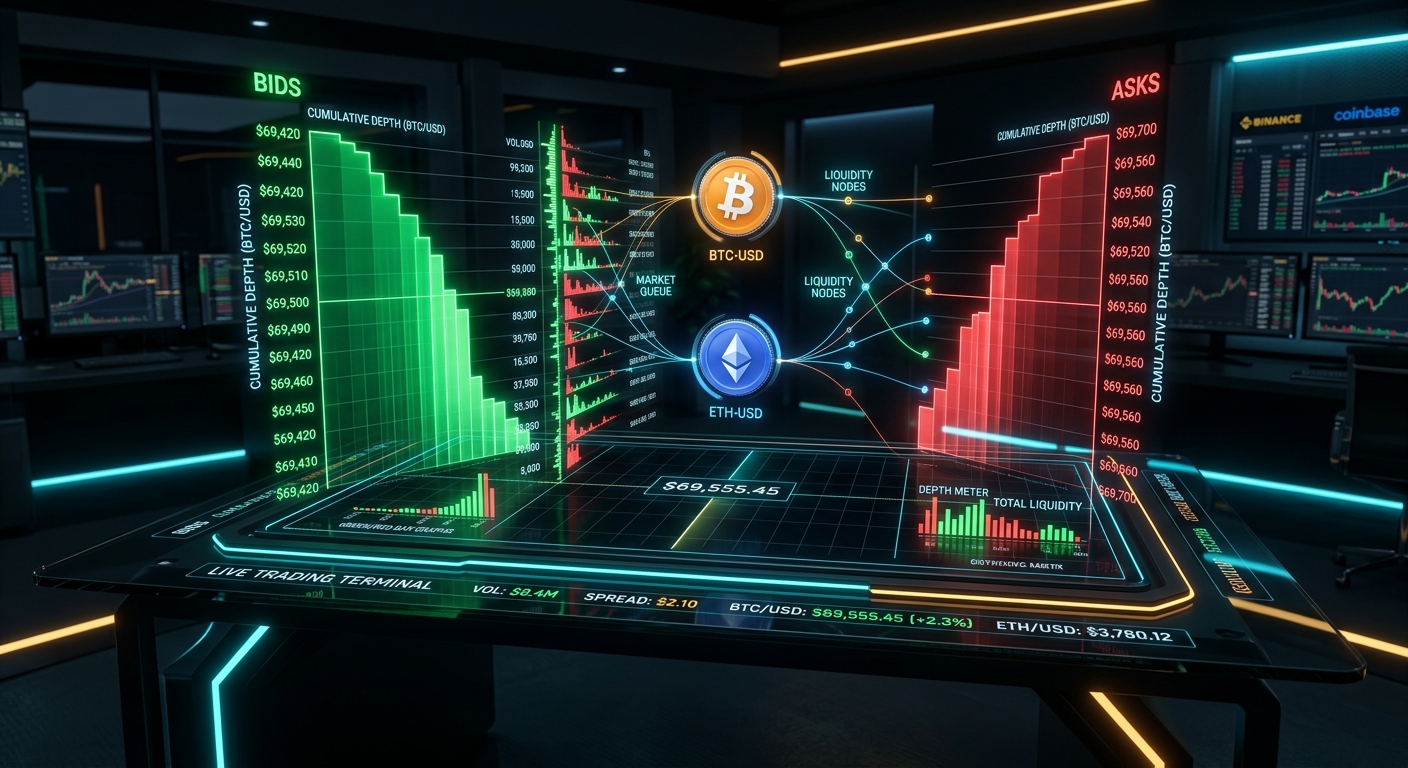
When you inspect a graphical market depth chart, you will frequently see steep vertical ledges known as Bid Walls or Ask Walls.
What a Real Liquidity Wall Means
A genuine liquidity wall occurs when an institutional participant (such as a crypto treasury, venture fund, or systematic market maker) places a massive resting limit order (e.g. 250 BTC at $92,000.00). This wall acts as a financial shock absorber; market sellers must dump $23,000,000 worth of Bitcoin before the market price can break below $92,000.
The Dark Side: Spoofing and Algorithmic Ghost Walls
Not all liquidity walls are real. Spoofing is an illegal manipulative tactic where an algorithmic trader places a massive limit order just below or above the current price to create the optical illusion of immense buying or selling pressure.
The spoofer has no intention of executing the order. As soon as smaller market participants react to the fake wall by bidding prices up, the spoofer sells into the artificial pump and cancels the fake bid wall within 15 milliseconds before any market order can fill against it.
Unique Case Study 1: The Liquidity Illusion ($500M Daily Volume vs. $40k Order Book Depth)
To illustrate why volume can be dangerously misleading, let us analyze a real-world microstructure comparison between two hypothetical crypto exchanges listing the same mid-cap altcoin ("COINX"):
| Microstructure Metric | Exchange A (Tier-1 Regulated) | Exchange B (Unregulated Offshore) |
|---|---|---|
| Reported 24h Volume | $18,000,000 | $520,000,000 (28x Higher!) |
| Top-of-Book Bid-Ask Spread | $10.00 / $10.01 (0.10% Spread) | $10.00 / $10.05 (0.50% Spread) |
| ±1% Bid Depth | $1,450,000 (Deep Institutional) | $22,000 (Paper-Thin) |
| ±1% Ask Depth | $1,620,000 (Deep Institutional) | $18,000 (Paper-Thin) |
| Simulated Slippage on $50,000 Market Buy | +$0.03 (0.30% Slippage) | +$0.82 (8.20% Slippage!) |
| Root Cause of High Volume | Real institutional flow | Wash-trading bots trading back-and-forth |
The Mathematical Breakdown:
A trader sees Exchange B’s flashy $520M reported volume and submits a $50,000 market buy order:
The trader lost $4,100 (8.2%) to slippage on Exchange B despite its advertised "$520M volume". Exchange B’s volume was generated by two automated wash-trading bots trading a single $500 balance back and forth 1,000,000 times a day with zero resting liquidity.
Unique Case Study 2: The Anatomy of a Spoofed Bid Wall (Microsecond Breakdown)
Let us examine the millisecond-by-millisecond execution timeline of an algorithmic spoofing attack on Bitcoin:
The Initial Setup:
The Timeline:
Retail traders who bought at $95,080 are left holding underwater positions, wondering where the "massive support" went.
Unique Case Study 3: Simulating a $2,000,000 Flash Sell Across Deep vs. Shallow Order Books
What happens when a crypto fund liquidates a $2,000,000 position of Ethereum (ETH) during an emergency risk-off event?
Let us simulate the exact order book sweep mechanics between Binance (Deep Liquidity) and a Mid-Tier Regional Exchange (Shallow Liquidity) when ETH is quoted at $3,000.00 ($2M = 666.67 ETH):
Execution on Binance (Deep Order Book)
| Price Level | Bid Price ($) | Volume Available (ETH) | Value ($) | Cumulative Value ($) |
|---|---|---|---|---|
| Level 1 | $3,000.00 | 120.00 ETH | $360,000.00 | $360,000.00 |
| Level 2 | $2,999.00 | 180.00 ETH | $539,820.00 | $899,820.00 |
| Level 3 | $2,997.50 | 250.00 ETH | $749,375.00 | $1,649,195.00 |
| Level 4 | $2,995.00 | 200.00 ETH | $599,000.00 | $2,248,195.00 |
Execution on Regional Exchange (Shallow Order Book)
| Price Level | Bid Price ($) | Volume Available (ETH) | Value ($) | Cumulative Value ($) |
|---|---|---|---|---|
| Level 1 | $3,000.00 | 15.00 ETH | $45,000.00 | $45,000.00 |
| Level 2 | $2,985.00 | 35.00 ETH | $104,475.00 | $149,475.00 |
| Level 3 | $2,950.00 | 80.00 ETH | $236,000.00 | $385,475.00 |
| Level 4 | $2,900.00 | 150.00 ETH | $435,000.00 | $820,475.00 |
| Level 5 | $2,820.00 | 200.00 ETH | $564,000.00 | $1,384,475.00 |
| Level 6 | $2,700.00 | 300.00 ETH | $810,000.00 | $2,194,475.00 |
By dumping on a shallow order book, the seller forfeited $126,366.00 in pure slippage—more than 100 times the loss suffered on Binance for the identical order.
Unique Case Study 4: Liquidity Disparity and Arbitrage Spread Windows
Because order book depth varies widely across exchanges, large market orders create structural pricing disparities between platforms.
Suppose a crypto whale dumps 1,000 SOL on Kraken, exhausting the local bid depth and dropping the Kraken SOL price from $180.00 to $177.50.
On Binance and OKX, deep institutional market maker liquidity absorbs similar selling with barely a $0.10 price movement ($179.90).
The Opportunity:
An automated arbitrage bot executing dual-inventory trades immediately buys SOL on Kraken at $177.80 and sells SOL on Binance at $179.90. The bot locks in a +1.18% risk-free spread while simultaneously providing the buying liquidity Kraken needs to restore price equilibrium.
This illustrates how arbitrageurs act as the vital connective tissue of global crypto liquidity.
How Professional Traders Monitor Order Book Depth
To trade effectively, professional quants utilize specialized market microstructure tools:
5 Golden Rules for Navigating Crypto Order Book Liquidity
The Final Word
Order book liquidity is the beating heart of digital asset markets. Prices do not move because of lines on a chart or abstract momentum indicators—they move because market orders consume resting limit orders in the order book.
By mastering the dynamics of market depth, bid-ask spreads, and liquidity asymmetry, you gain an insurmountable quantitative edge in predicting price action and protecting your execution capital.