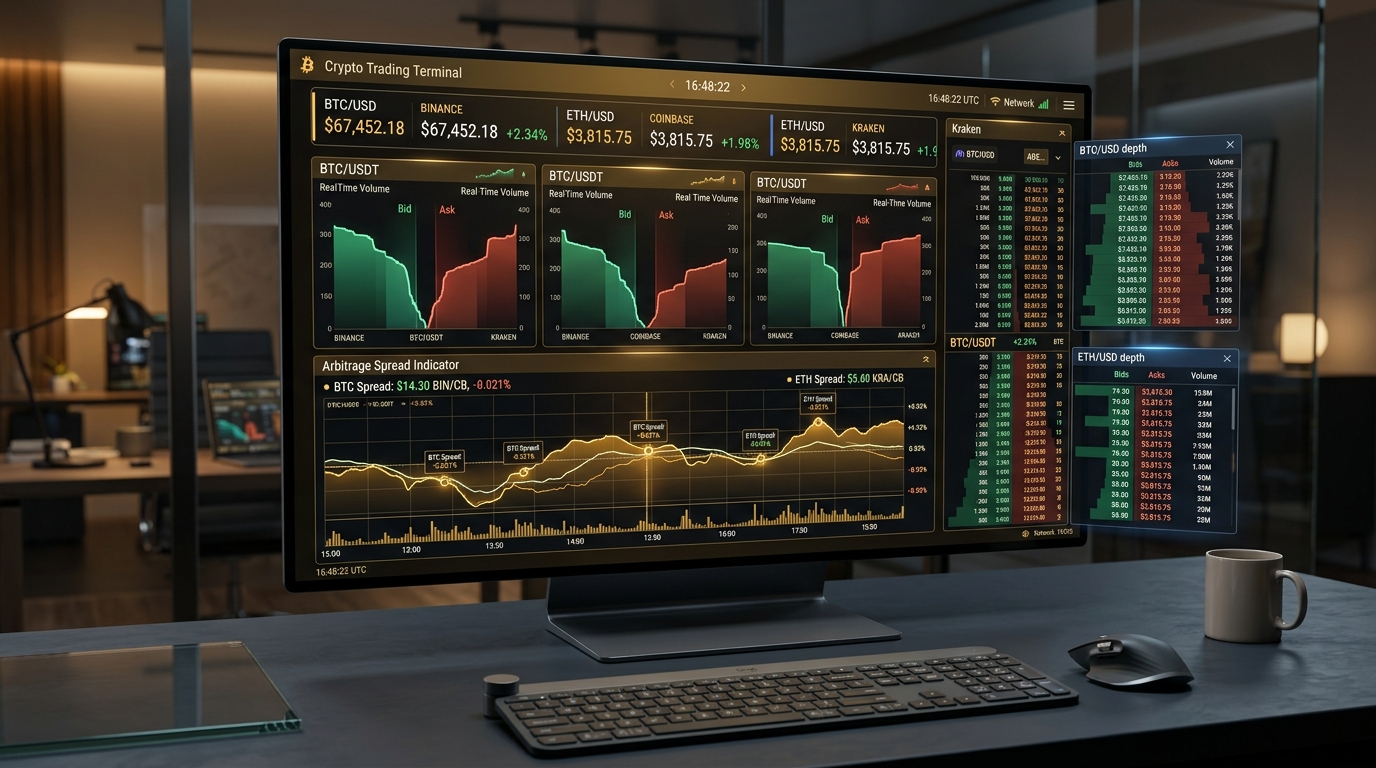
If you open three different trading monitors simultaneously—say, Binance, Coinbase Pro, and Kraken—you will immediately notice a perplexing reality: Bitcoin is trading at $96,480 on one exchange, $96,720 on another, and $96,350 on the third. For new and intermediate traders who transitioned from traditional equities or foreign exchange, this feels like an anomaly or a technical glitch. In equities, after all, the National Market System (NMS) and the Consolidated Tape Association enforce the National Best Bid and Offer (NBBO), mandating that brokers route orders to whichever venue provides the best prevailing price.
In the cryptocurrency ecosystem, however, there is no centralized regulator, no consolidated tape, and no unified global matching engine. Every single cryptocurrency exchange operates as an independent liquidity silo. What retail tracking websites display as "the price of Bitcoin" is nothing more than a lagging volume-weighted mathematical average (VWAP) computed across selected reporting feeds. For active crypto traders, understanding why these price discrepancies occur, how order book microstructure governs them, and how to accurately compare prices across venues is the difference between consistent profitability and burning capital on phantom arbitrage.
Section 1: The Four Pillars of Cross-Exchange Price Divergence
Why do prices diverge in the first place? If an asset is identical—a Satoshi on Kraken has the exact same cryptographic properties as a Satoshi on Bybit—why would someone pay $200 more for it on one platform? Price variance across cryptocurrency exchanges stems from four structural pillars: order book isolation, regional capital constraints, fiat on-ramp velocity, and institutional order flow segmentation.
1. Order Book Isolation and Liquidity Silos
Each centralized exchange (CEX) is a self-contained matching engine matching localized buyers against localized sellers. When a large hedge fund executes a $40 million market buy order on Coinbase, that order consumes the immediate sell liquidity (the Ask ladder) on Coinbase exclusively. The matching engines of Binance in Tokyo, OKX in Seychelles, and Kraken in San Francisco are completely untouched by that specific matching event. Until external market participants intervene, Coinbase will trade at a substantial premium relative to the rest of the world.
2. Fiat Banking Rails and Regional Capital Controls
Exchanges do not merely trade crypto-to-crypto; they act as primary fiat on-ramps. Consider the famous South Korean "Kimchi Premium." Under South Korea's Foreign Exchange Transactions Act, moving large sums of KRW or foreign capital out of the country is strictly regulated. When domestic retail demand surges on exchanges like Upbit and Bithumb, local buyers bid up BTC and ETH by 3% to 8% above global USD rates. Foreign arbitrageurs cannot easily purchase BTC cheaply on Binance and dump it on Upbit because repatriating the fiat back to international USD accounts encounters strict regulatory bottlenecks. This geographical isolation creates persistent structural premiums.
3. Fiat Settlement Velocity and On-Ramp Friction
Capital does not move instantaneously. While a crypto transaction may confirm in 10 to 60 minutes, a standard SWIFT wire transfer takes 24 to 72 hours. FedNow and SEPA Instant have mitigated this within the US and EU, but cross-border fiat settlement remains sluggish. If a sudden crash occurs on an exchange with rapid fiat deposits, capital rushes in faster to buy the dip than on an exchange with delayed banking cut-offs, creating temporary dislocations.
4. Segmented Institutional Order Flow
Ever since the approval of US Spot Bitcoin and Ethereum ETFs, institutional flow has concentrated disproportionately on custodial venues like Coinbase Prime and Gemini. During the 3:30 PM to 4:00 PM EST market close window (the Benchmark Fix window), tens of millions of dollars in ETF creation/redemption orders hit these specific order books. This concentrated flow creates violent, predictable divergence against retail-heavy offshore venues like Bybit and KuCoin.
Section 2: Real-World Case Studies in Price Discrepancies
To understand how price comparison plays out in live trading conditions, let us analyze three distinct real-world market scenarios that every active trader will encounter.
Case Study A: The Phantom 1.8% Spread and the Order Book Depth Trap
Imagine an active trader, Alex, monitoring a newly trending Layer-1 token (TOKEN-X). On Exchange A, the last-traded price displays $4.00. On Exchange B, the last-traded price displays $4.072—a seemingly effortless 1.80% gross profit window. Excited by the prospect of a quick gain, Alex buys $50,000 worth of TOKEN-X on Exchange A with a market order and immediately attempts to sell it on Exchange B.
The result? Alex ends up losing $1,400 on the round trip. How did a +1.80% spread turn into a -2.80% net loss?
Alex fell into the classic "Last Traded Price vs. Top-of-Book Depth" trap. The last trade on Exchange B occurred at $4.072 for a tiny retail lot of $120. However, the actual highest Bid (the highest price buyers were currently willing to pay) was only $4.01, and that bid tier had only $1,500 of cumulative volume. Below that, bids dropped sharply to $3.94 and $3.88. When Alex dumped $50,000 onto the bid ladder of Exchange B, the market order chewed through the thin liquidity down to $3.85, resulting in severe negative slippage. Combined with 0.10% taker fees on both exchanges and a $150 token withdrawal fee, the perceived arbitrage vanished into thin air.
Case Study B: The Institutional ETF NAV Rebalancing Spread
During high-volatility macro news days (such as Federal Reserve FOMC rate announcements or CPI releases), US institutional desks aggressively rebalance spot ETF positions on Coinbase Pro. On a recent Wednesday at 2:00 PM EST, Bitcoin traded at $97,200 on Binance with deep USDT liquidity, while Coinbase BTC/USD surged to $97,850—a massive $650 per Bitcoin divergence (0.67%).
Unlike the illiquid altcoin in Case Study A, both venues possessed multi-million-dollar order books within ±0.20% of the mid-market price. Quantitative algorithmic desks running automated high-frequency strategies were able to lock in substantial risk-free returns. However, they did not achieve this by buying on Binance and physically sending the coins across the blockchain to Coinbase (which would take 2 to 3 Bitcoin block confirmations, or 20-30 minutes). Instead, they utilized pre-funded balance reserves on both exchanges: simultaneously buying BTC on Binance while selling an identical amount of BTC on Coinbase in a single millisecond tick, completely eliminating transfer latency risk.
Case Study C: The DEX vs. CEX Liquidity Dislocation during Network Congestion
During major NFT mints or sudden memecoin manias on Ethereum L1, gas fees routinely spike from 15 Gwei to over 150 Gwei ($35+ per Uniswap swap). During one such event, Ethereum spot traded at $3,420 on Binance, while the Uniswap v3 ETH/USDC 0.05% pool lagged at $3,452 (a 0.93% discrepancy).
A retail trader attempting to swap 2 ETH on Uniswap and sell on Binance would discover that the $70 DEX gas execution cost, combined with the $25 CEX deposit fee and 0.075% taker fee, entirely consumed the $64 price difference. Meanwhile, a whale trading 200 ETH ($684,000) was able to capture over $5,000 in net profit because the fixed gas fee represented a negligible 0.01% fraction of their total trade volume. Cross-exchange price efficiency is inherently scale-dependent.
Section 3: Executable Best Bid/Offer (EBBO) vs. Deceptive Last-Traded Price
The single most critical concept in cryptocurrency price comparison is understanding the difference between the Last-Traded Price and the Gross Executable Spread.
GES = Highest Bid (across all exchanges) - Lowest Ask (across all exchanges).If the Highest Bid on Exchange B is $96,500 and the Lowest Ask on Exchange A is $96,400, the Gross Executable Spread is +$100 (+0.103%). Only when this number is positive does a theoretical instantaneous market arbitrage exist. If the Highest Bid on Exchange B is $96,380 while the Lowest Ask on Exchange A is $96,400, the executable spread is negative (-$20), meaning any immediate two-way trade will result in an instantaneous baseline loss.
Section 4: The Full Cost Waterfall Matrix
Before evaluating any price difference between two exchanges, professional traders pass the raw spread through a comprehensive "Cost Waterfall". If the raw spread does not exceed the cumulative sum of all friction points, the trade is economically non-viable.
Here is the exact mathematical breakdown of the four cost tiers:
Tier 1: Two-Leg Trading Fees (Maker vs. Taker)
Every cross-exchange operation involves two distinct transactions: buying on Venue A and selling on Venue B. If you execute via market orders, you pay taker fees on both sides. On standard entry-tier accounts, Binance charges 0.10% (0.075% with BNB), Kraken charges 0.25% taker (0.16% maker), Coinbase Advanced charges up to 0.60% taker, and OKX charges 0.10%. A round-trip market execution between Coinbase and Kraken can easily cost 0.85% in pure exchange commissions. Unless the cross-venue price difference exceeds 0.90%, you are donating capital directly to the exchanges.
Tier 2: Order Book Slippage & Market Impact
As demonstrated in our slippage modeling, an order book is not a flat price; it is a discrete ladder of quantities. A $10,000 order may experience 0.02% slippage on a $500M daily volume pair like BTC/USDT on Binance, but that same $10,000 order might experience 1.8% slippage on a $2M daily volume altcoin pair on a smaller regional exchange. True price comparison must factor in the depth available at ±0.5% and ±1.0% bands.
Tier 3: Blockchain Transfer Gas & Fixed Withdrawal Fees
If you do not maintain pre-funded accounts and must transfer tokens on-chain, exchanges charge fixed withdrawal levies. Withdrawing Bitcoin from an exchange might cost a flat 0.0002 to 0.0005 BTC ($19 to $48). Withdrawing ERC-20 tokens can cost $5 to $30 depending on network gas. On a $2,000 trade, a $30 withdrawal fee represents an immediate 1.50% performance drag.
Tier 4: Transfer Confirmation Latency & Volatility Exposure
The crypto market operates 24/7/365 with extreme micro-volatility. Bitcoin requires 1 to 3 block confirmations (10 to 30 minutes); Ethereum requires 32 to 64 epochs (12 to 15 minutes) for finalized CEX crediting; Solana and Layer-2 networks take seconds to minutes. During a 20-minute transfer window, the price of Bitcoin can easily swing ±1.5%, completely eclipsing any initial 0.40% price discrepancy you set out to capture.
Section 5: How Quantitative Desks Exploit Price Differences
How do market makers and high-frequency quantitative desks (like Wintermute, Jump Trading, and Flow Traders) consistently harvest billions in cross-exchange price discrepancies without losing money to transfer latency and gas fees?
The answer lies in two core architectural models: the Pre-Funded Inventory Rebalancing Model and the Synthetic / Perpetual Hedging Model.
Model A: The Pre-Funded Inventory Architecture (Zero On-Chain Latency)
Instead of moving funds sequentially (Buy on A -> Withdraw -> Deposit on B -> Sell on B), quantitative desks maintain substantial balances of both fiat/stablecoins (USD, USDT, USDC) and inventory crypto (BTC, ETH, SOL) across all top 6 exchanges simultaneously. When a 0.35% executable spread appears between Binance and Kraken, their colocation servers in Equinix data centers detect the discrepancy in sub-millisecond time. The algorithm triggers two simultaneous API market executions: Buy 10 BTC on Binance at $96,400 using USDT reserves, and Sell 10 BTC on Kraken at $96,737 using pre-existing BTC inventory. The trade concludes in under 15 milliseconds with zero blockchain transit risk. At the end of the trading day, the desk performs a single bulk rebalancing transfer over high-speed networks or institutional clearing networks (such as Copper ClearLoop or Fireblocks Off-Exchange Settlement).
Model B: Synthetic Perpetual Funding Rate Arbitrage (Cash and Carry)
When spot prices on retail spot exchanges trade higher than perpetual futures on derivatives platforms, traders capture the basis spread by going Long Spot on the cheaper venue while simultaneously opening a 1x Short Perpetual on the expensive venue. This delta-neutral position isolates the price differential while harvesting positive hourly funding rates from overleveraged retail longs.
Section 6: The Seven-Step Pre-Flight Protocol for Comparing Crypto Prices
Before taking action on any price difference you identify on a live comparison screen or market scanner, follow this battle-tested 7-step checklist:
Conclusion: Turning Price Comparison into Structural Trading Edge
Price divergence across cryptocurrency exchanges is not a temporary flaw of the industry—it is a fundamental, permanent feature of a decentralized, globally fragmented financial architecture. While traditional financial markets consolidate pricing through government-mandated infrastructure, crypto empowers decentralized market participants to establish localized equilibrium.
For active traders and quantitative analysts, tools like the LiveCryptoPrices comparison engine, real-time depth ladders, and interactive arbitrage calculators provide the visibility required to look past superficial last-traded prices. By mastering order book microstructure, evaluating executable spreads, and respecting the full cost waterfall, you can transform fragmented market data into an enduring, repeatable trading edge.