Imagine standing in the middle of a massive global bazaar with hundreds of independent merchants selling the exact same physical gold coin. Merchant A in Tokyo quotes $2,500. Merchant B in New York quotes $2,525. Merchant C in London quotes $2,490.
In traditional finance, high-frequency market-making algorithms and consolidated regulatory feeds close these price gaps in microseconds. But in the multi-trillion dollar cryptocurrency ecosystem—spanning over 500 centralized exchanges, thousands of decentralized AMM pools, and distinct regulatory jurisdictions—price gaps are not occasional anomalies; they are the permanent heartbeat of the market.
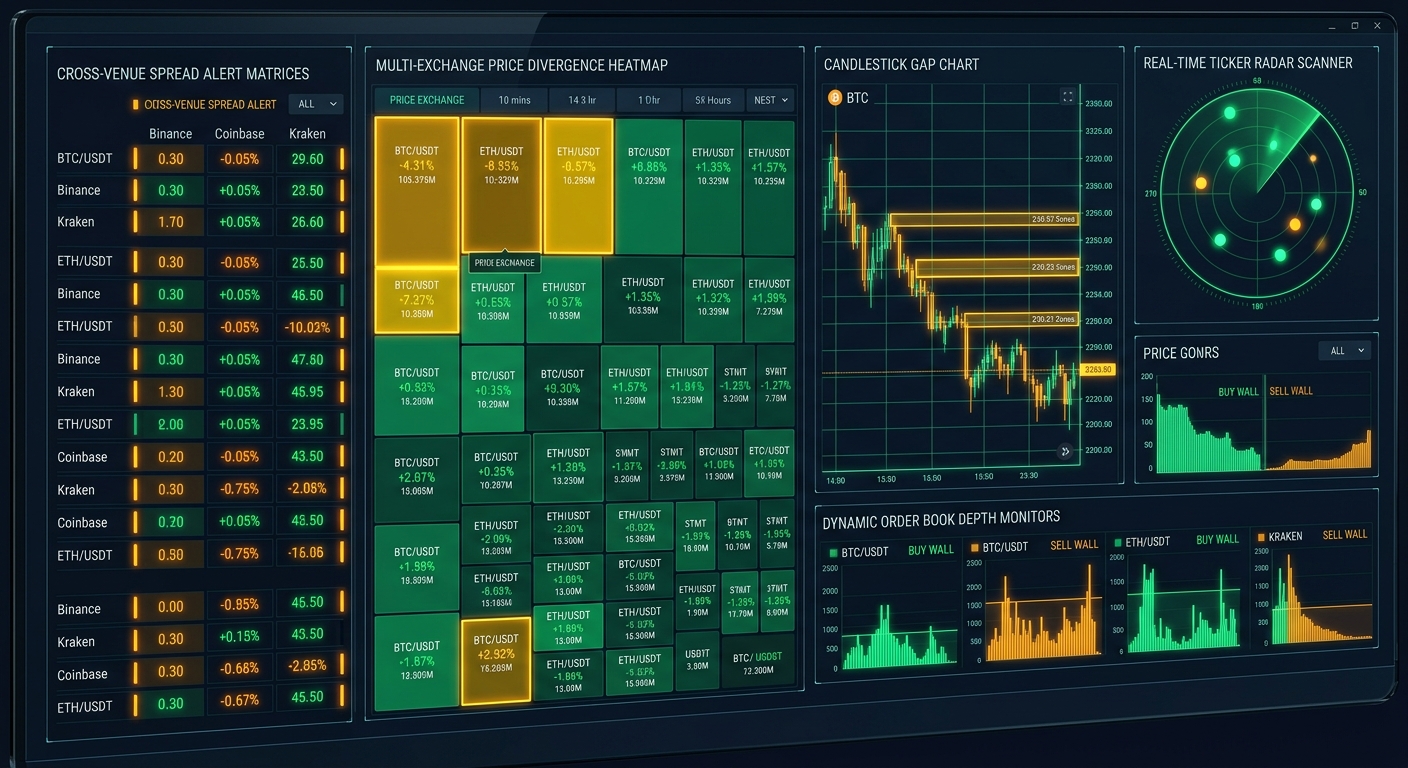
On any given trading day, Bitcoin, Ethereum, and mid-cap altcoins exhibit hundreds of price gaps ranging from 0.20% to over 6.0%. The traders who consistently profit from these dislocations do not manually refresh twenty browser tabs. They deploy a Crypto Price Gap Scanner.
In this comprehensive guide, we will explore how price gap scanners work under the hood, dissect the three distinct types of crypto gaps, examine historical market dislocations, and provide an institutional playbook for turning price gaps into profitable trading alpha.
Section 1: The Three Types of Crypto Price Gaps
Novice traders often assume all price gaps are identical. Professional quantitative traders categorize gaps into three structurally different market events:
1. Cross-Exchange Spatial Price Gaps (Inter-Venue Dispersion)
A spatial price gap occurs when the spot price of an asset diverges simultaneously across two or more competing exchanges:
Spatial Gap ($) = Price(Exchange A) - Price(Exchange B)Relative Gap (%) = ((Price(Exchange A) - Price(Exchange B)) / Price(Exchange B)) * 100Why does this happen? When a large market participant places a $50 million market buy order on Coinbase, Coinbase’s order book sweeps upward instantly. Until cross-exchange arbitrage algorithms transfer liquidity and hedge positions on Binance, Bybit, or Kraken, a multi-dollar spatial price gap exists.
2. CME Institutional Weekend & Session Gaps (Temporal Gaps)
The Chicago Mercantile Exchange (CME) is the premier institutional venue for Bitcoin and Ether regulated futures contracts. Unlike crypto exchanges which trade 24/7/365, CME trading closes every Friday at 5:00 PM EST and reopens Sunday at 6:00 PM EST.
If Bitcoin trades at $92,000 on Friday afternoon and spot markets surge to $96,000 over the weekend on retail momentum, CME futures will gap up by +$4,000 at the Sunday open:
CME Gap ($) = CME_Sunday_Open_Price - CME_Friday_Close_PriceInstitutional statistics show that historically, over 78% of CME Bitcoin gaps are eventually filled (price returns to touch the pre-gap level) as market makers balance basis trades during the subsequent trading week.
3. Order Book Liquidity Voids (Flash Gaps & Cascade Wicks)
When leveraged long or short positions are liquidated on derivatives exchanges (like Bybit, Binance Futures, or OKX), the matching engine forcefully executes market orders into the order book.
If market depth is insufficient, price punches through multiple price tiers in a fraction of a second, creating a vertical "wick" or liquidity void. A price gap scanner identifies when an asset’s local price has deviated more than 3 standard deviations from its global consolidated weighted index.
Section 2: How a Crypto Price Gap Scanner Works Under the Hood
What makes a professional price gap scanner different from a standard price tracker? It comes down to data ingestion speed, quote normalization, and statistical filtering.
1. Multi-Venue WebSocket Stream Aggregation
A dedicated scanner does not poll sluggish REST APIs every 30 seconds. It establishes continuous, concurrent WebSocket connections to raw Level 1 and Level 2 order book streams across global venues.
The scanner’s ingestion engine processes incoming ticker and book-ticker packets in sub-50 milliseconds, tracking Bid, Ask, Mid-Price, and 24h Volume simultaneously.
2. Synthetic Quote Currency Normalization
A common pitfall in naive price comparisons is confusing fiat USD with stablecoins (USDT, USDC, FDUSD, EUR). If USDT trades at $0.998 on secondary markets, a BTC/USDT price of $96,000 is actually equivalent to $95,808 in pure USD.
An institutional scanner automatically normalizes all quotes against real-time stablecoin exchange rates:
Normalized_Price = Raw_Price * (Quote_Currency_USD_Peg)This ensures that the price gaps flagged by the scanner represent true arbitrageable value rather than currency translation artifacts.
3. Rolling Z-Score Statistical Anomaly Detection
Not every 0.30% price gap is worth trading. On illiquid altcoins, a 0.30% gap might simply reflect standard bid-ask spread friction. An advanced scanner computes the rolling Z-score of the spread over a 24-hour lookback window:
Z-Score = (Current_Spread - Mean_Spread_24h) / Standard_Deviation_24hWhen the Z-score exceeds +2.5 or +3.0, the scanner flags a statistically significant dislocation that represents genuine market inefficiency.
Section 3: Real-World Case Studies: Historic Gaps Captured by Quantitative Scanners
To understand how price gap scanning generates edge in live markets, let us examine three definitive historical case studies:
Case Study 1: The August 2024 Global "Yen Carry Trade" Flash Crash
On Monday, August 5, 2024, the sudden unwinding of the Japanese Yen carry trade triggered a massive liquidation cascade across global risk assets. Bitcoin plummeted from $58,000 to $49,200 within hours.
During the peak of the cascade between 06:00 and 07:30 UTC:
Traders with pre-positioned balances on Kraken and Binance simultaneously bought on Kraken and sold on Binance, locking in thousands of dollars in delta-neutral profit while capturing the rapid 20-minute mean-reversion as prices reconverged to $51,000.
Case Study 2: The Grayscale GBTC Discount Arbitrage & ETF Conversion Gap (2023–2024)
For over two years, the Grayscale Bitcoin Trust (GBTC) traded at a massive discount to its Net Asset Value (NAV), widening to as much as -48.8% in December 2022.
Quantitative desks deployed continuous gap scanners monitoring the spread between GBTC’s market price and the spot Bitcoin price backing each share. When Grayscale won its landmark court battle against the SEC in August 2023, the scanner signaled that the gap would mathematically compress to 0% upon spot ETF conversion.
Desks that bought GBTC while shorting Bitcoin futures captured a massive +45% non-directional basis convergence gain when spot ETFs officially launched in January 2024.
Case Study 3: The Monday Morning CME Gap Fill Playbook
In October 2024, Bitcoin closed the CME Friday session at $64,200. Over the weekend, geopolitical headlines pushed Bitcoin spot prices down to $62,100, creating a -$2,100 CME downside gap.
At the Sunday 6:00 PM EST open, institutional gap scanners triggered a high-probability "CME Gap Fill" signal. As Asian and European markets opened on Monday, institutional algorithmic buying absorbed the discount, driving spot prices back up to $64,250 within 18 hours and completely filling the gap with a clean +3.4% upside bounce.
Section 4: Four Battle-Tested Strategies for Trading Price Gaps
Once your scanner identifies a live price gap, how do you execute? Here are the four primary strategies used by professional traders:
1. The Pre-Funded Cross-Venue Arbitrage (Zero Transfer Risk)
The safest way to exploit a spatial gap flagged by the scanner is the dual-balance method:
Buy 0.5 BTC on Exchange A and Sell 0.5 BTC on Exchange B.2. The Statistical Mean-Reversion Scalp
When an intra-exchange flash crash or liquidation wick occurs on a single pair (Z-score > 3.0):
3. The CME Weekend Gap Fill Swing Trade
When CME futures open Sunday evening with a gap greater than 1.5% relative to Friday’s close:
4. The Funding Rate Basis Harvest
When a price gap scanner alerts you that perpetual futures are trading at a significant premium over spot prices (e.g., Perp basis +0.40% and 8-hour funding rate +0.08%):
Section 5: Key Pitfalls to Avoid When Using a Price Gap Scanner
Even with the fastest scanner, execution discipline is paramount. Watch out for these common traps:
Section 6: How to Set Up Your Real-Time Price Gap Workflow
To maximize your trading efficiency, follow this structured 4-step daily workflow:
Conclusion: The Scanner is Your Unfair Market Advantage
Cryptocurrency markets move at blinding speed across hundreds of fragmented venues. Trying to spot profitable price discrepancies with the naked eye is an exercise in frustration and missed opportunities.
A real-time Crypto Price Gap Scanner levels the playing field—automating data ingestion, normalizing multi-currency quotes, and surfacing high-probability spatial, temporal, and liquidity dislocations before the broader market reacts.
By combining real-time scanner intelligence with disciplined cost modeling and proper execution risk management, you turn market fragmentation into your most consistent source of trading alpha.