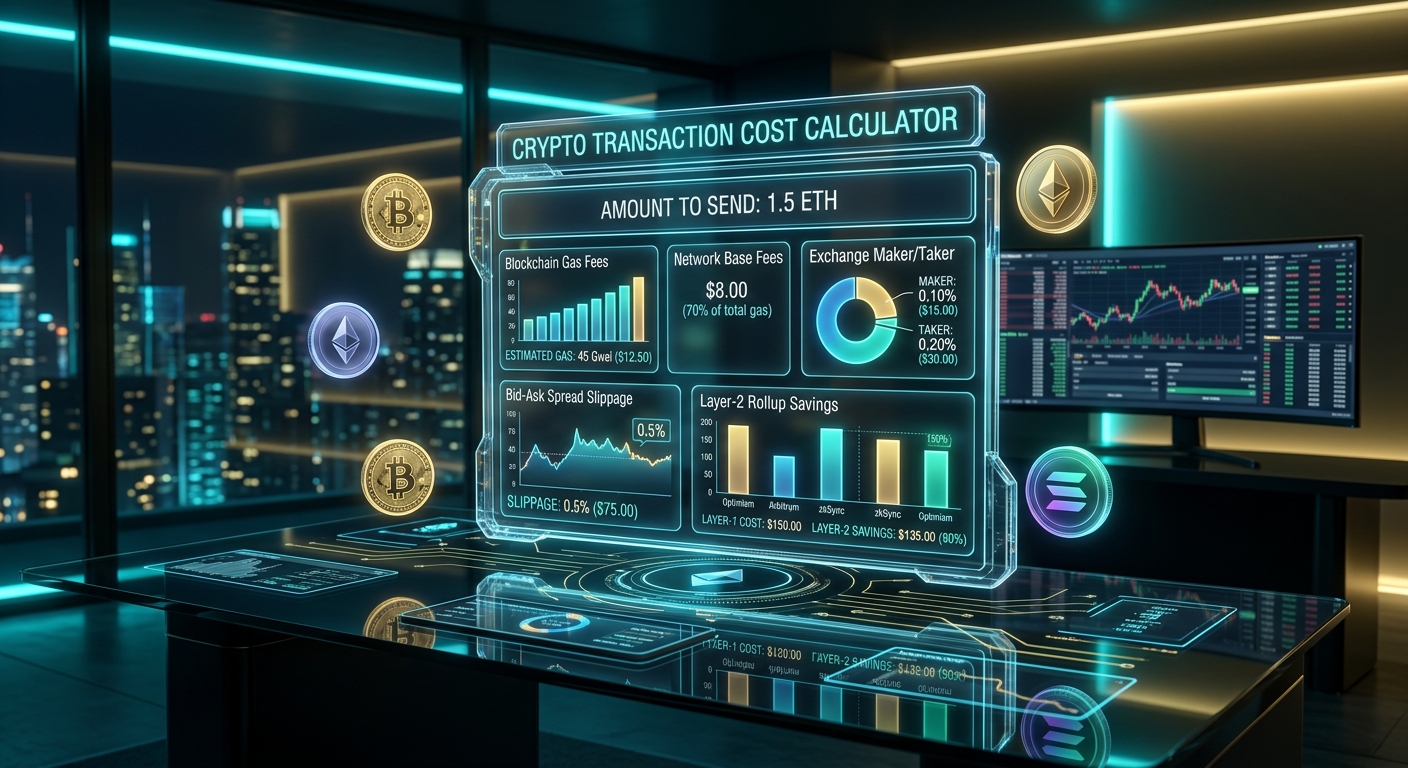
Every day, millions of cryptocurrency investors and traders click "Send" or "Confirm Swap" expecting to pay a negligible fee, only to discover a chunk of their capital has vanished into the ether.
A beginner trader buys $500 worth of an altcoin on a decentralized exchange and is stunned to see $38 deducted in Ethereum gas and liquidity pool slippage. A swing trader executes a $25,000 market order on a centralized exchange, oblivious to the fact that order book depth slippage just cost them $180 on top of the published $25 trading fee. An on-chain farmer bridges $10,000 between blockchains and pays a triple-toll of origin gas, bridge protocol fees, and destination claim execution.
In the decentralized economy, transaction costs are not a single flat line item. They are a multi-layered ecosystem of blockchain network incentives, exchange order matching algorithms, order book liquidity depth, and cross-chain communication protocols.
If you cannot accurately calculate your All-In Transaction Friction, you are trading blind. A strategy that appears to generate a 5% monthly return can easily bleed into negative territory once the true cumulative friction is accounted for.
In this comprehensive guide, we provide the complete mathematical architecture of a Crypto Transaction Cost Calculator, break down the four distinct cost pillars, walk through four unique real-world numerical calculation examples, and reveal proven tactical strategies to slash your transaction drag by over 80%.
The Anatomy of a Crypto Transaction: The 4 Cost Pillars
To build a bulletproof transaction cost calculator, you must account for every layer of friction between your initial decision and final settlement:
1. Blockchain Network Gas & Miner/Validator Incentives
Gas represents the computational effort required to execute an action on a decentralized blockchain. Following Ethereum’s EIP-1559 and similar mechanisms on Solana, Avalanche, and Layer-2 rollups, network gas consists of:
Total Network Gas Cost = Gas Units Consumed × (Base Fee + Priority Fee) × Native Token Market Price2. Centralized Exchange (CEX) Maker vs. Taker Fees
When trading on centralized platforms (Binance, Coinbase, Kraken, Bybit, OKX):
Most casual traders default to market orders, inadvertently paying top-tier taker rates that can be 5x to 10x higher than maker rates.
3. Bid-Ask Spread & Market Depth Slippage
Slippage is the difference between the expected price of a trade and the actual weighted average execution price.
Slippage Cost = Order Size × |Average Execution Fill Price - Top-of-Book Quote Price|4. Gateway, On/Off-Ramp & Cross-Chain Bridge Tolls
Moving capital between fiat bank accounts and crypto, or routing assets across different blockchains (e.g. Ethereum to Arbitrum or Solana), incurs:
The Master Formula for All-In Crypto Transaction Cost
To calculate the exact total dollar friction for any crypto operation, use the Universal Transaction Friction Equation:
Total Friction ($) = Cost_NetworkGas + Cost_ExchangeFee + Cost_Slippage + Cost_BridgeRampFriction Percentage (%) = (Total Friction / Total Transaction Nominal Value) × 100Now, let us test this master formula against four unique real-world scenarios.
Unique Calculation Example 1: Ethereum Layer-1 vs. Arbitrum Layer-2 DEX Swap
Suppose a DeFi trader wants to swap $5,000.00 USDC into Wrapped Ethereum (WETH) on Uniswap during moderate network traffic (ETH price = $3,000.00).
Let us calculate the exact cost differences between executing on Ethereum Mainnet (Layer-1) versus Arbitrum One (Layer-2 Rollup).
| Parameter | Ethereum Layer-1 Mainnet | Arbitrum One Layer-2 Rollup | Cost Difference |
|---|---|---|---|
| Gas Units Required | 145,000 units (Complex Router Swap) | 145,000 L2 computational gas | Identical EVM computation |
| Base Fee / Gas Price | 28 Gwei ($0.000000028 ETH) | 0.10 Gwei ($0.0000000001 ETH) | 280x cheaper base price |
| L1 Data Availability (Blob) Cost | N/A ($0.00) | 0.000008 ETH (~$0.024) via EIP-4844 Blobs | Tiny rollup post fee |
| Total Network Gas Fee ($) | $12.18 (145,000 × 28 Gwei × $3,000) | $0.07 ($0.043 L2 Gas + $0.024 Blob Post) | 99.4% Gas Savings on L2 |
| Uniswap Pool Fee (0.05% tier) | $2.50 (0.05% of $5,000) | $2.50 (0.05% of $5,000) | Identical protocol fee |
| AMM Pool Price Slippage (0.03%) | $1.50 ($5,000 × 0.0003) | $1.50 ($5,000 × 0.0003) | Identical deep liquidity |
| Total All-In Transaction Cost | $16.18 | $4.07 | -$12.11 (-74.8% Total Cost Reduction) |
| Effective Friction Rate (%) | 0.3236% of trade value | 0.0814% of trade value | 4x Lower Total Drag |
The Key Takeaway: On Ethereum Layer-1, network gas accounted for 75.3% ($12.18 / $16.18) of the entire transaction cost. On Arbitrum Layer-2, gas shrunk to just 1.7% ($0.07 / $4.07) of total cost, making the protocol liquidity fee the only meaningful expense.
Unique Calculation Example 2: The $50,000 Institutional CEX Order (Slippage vs. Taker Fees)
Imagine a crypto hedge fund executing a $50,000 market buy order for Bitcoin on an exchange with $95,000 BTC price.
The exchange advertises a standard taker fee of 0.10% ($50.00). However, let us examine the exchange’s live Level-2 Order Book Depth at that exact millisecond:
Let us calculate how the $50,000 market order fills as it sweeps through the order book:
Summary of Execution Math:
Total Real Transaction Cost = $51.18 (Slippage) + $50.00 (Taker Fee) = $101.18Real Friction Rate = ($101.18 / $50,000) × 100 = 0.2024% (More than DOUBLE the advertised fee!)By failing to use an iceberg limit order or algorithmic TWAP (Time-Weighted Average Price) execution, the trader paid more in order book slippage ($51.18) than in actual exchange trading fees ($50.00).
Unique Calculation Example 3: Cross-Chain Yield Rebalancing ($10,000 USDC Polygon to Avalanche)
An on-chain yield farmer wishes to rebalance $10,000 USDC from Polygon to Avalanche to capture a higher lending rate on Aave.
Let us calculate the multi-step transaction cost model for this cross-chain journey:
| Journey Step | Action Description | Fee Mechanism | Dollar Cost |
|---|---|---|---|
| Step 1 | Approve Stargate Bridge Contract on Polygon | Polygon POL Gas (45,000 gas @ 35 Gwei) | $0.008 |
| Step 2 | Initiate Cross-Chain Transfer on Origin Chain | Polygon POL Gas (180,000 gas @ 35 Gwei) | $0.032 |
| Step 3 | Stargate/LayerZero Protocol Bridge Fee | 0.06% liquidity rebalancing toll | $6.000 ($10,000 × 0.0006) |
| Step 4 | Destination Chain Message Relayer & Gas Drop | Avalanche C-Chain gas paid to relayer (0.015 AVAX @ $25/AVAX) | $0.375 |
| Step 5 | Deposit USDC into Aave v3 on Avalanche | Avalanche AVAX Gas (220,000 gas @ 28 nAVAX) | $0.154 |
| Total Journey Cost | 5 Sequential Operations | All-In Multi-Chain Protocol Friction | $6.569 |
| Effective Bridge Friction | $6.57 on $10,000 Capital | Break-Even Requirement | 0.0657% of principal |
Strategic Insight: Because Polygon and Avalanche both feature low gas costs, the protocol bridge fee ($6.00) accounted for 91.3% of total transaction friction. To justify this rebalancing, the Avalanche lending yield must generate at least $6.57 in excess yield within the farmer’s planned holding period.
Unique Calculation Example 4: The Micro-Transaction Shock ($25 USDT Transfer)
What happens when you send a small amount of money? This is where fixed network costs create devastating friction percentages.
Suppose a user sends $25.00 USDT across four different blockchain networks:
| Network Route | Typical Gas / Transfer Fee | Dollar Cost | Percentage Loss on $25 Transfer | Economic Feasibility |
|---|---|---|---|---|
| Ethereum Mainnet (ERC-20) | 65,000 gas @ 30 Gwei (ETH = $3,000) | $5.85 | 23.40% Loss | ❌ Highly Inefficient |
| Tron (TRC-20 USDT) | 13.5 TRX (Energy burn fee @ $0.15/TRX) | $2.025 | 8.10% Loss | ⚠️ Moderate Friction |
| Arbitrum One (L2 USDT) | L2 execution + L1 Blob data post | $0.028 | 0.11% Loss | ✅ Extremely Efficient |
| Solana (SPL USDT) | 0.000005 SOL + 0.000025 SOL Priority Tip | $0.004 | 0.016% Loss | ⚡ Near-Zero Friction |
Sending $25 on Ethereum mainnet destroys nearly one-quarter of the total capital in a single hop. The exact same transfer on Solana or Arbitrum incurs less than three cents in friction.
2026 Crypto Transaction Cost Comparison Matrix Across Top Blockchains
Here is how the major Layer-1 and Layer-2 blockchains compare across standard transaction types:
| Blockchain Network | Native Coin Transfer Cost | Smart Contract Token Swap Cost | Average Settlement Time | Primary Cost Driver |
|---|---|---|---|---|
| Ethereum (L1) | $0.80 - $3.50 | $4.50 - $25.00+ | 12 - 15 seconds | Global blockspace bidding & EVM computation |
| Arbitrum One (L2) | $0.01 - $0.04 | $0.05 - $0.25 | Sub-second (Soft) / 15m (L1) | L1 Blob posting overhead |
| Base (L2) | $0.008 - $0.03 | $0.04 - $0.20 | Sub-second (Soft) / 15m (L1) | Coinbase sequencer & EIP-4844 blobs |
| Solana | $0.001 - $0.005 | $0.005 - $0.03 | 400 milliseconds | Localized priority fee accounts & proof-of-history |
| Polygon PoS | $0.005 - $0.02 | $0.03 - $0.15 | 2.5 seconds | State sync validation & gas limit |
| Avalanche (C-Chain) | $0.02 - $0.08 | $0.10 - $0.45 | 1 - 2 seconds | Dynamic base fee & snowman consensus |
| Bitcoin (L1 On-Chain) | $0.75 - $6.00+ | N/A (UTXO native only) | 10 - 60 minutes | Satoshis per vByte (sat/vB) mempool queue |
| Bitcoin (Lightning Network) | $0.0001 - $0.001 | N/A | Instant (<1 second) | Channel routing fee (ppm) |
6 Actionable Strategies to Slash Crypto Transaction Costs by 80%+
Summary Checklist: Before You Click "Confirm"
Before executing your next crypto trade or transfer, run through this mental calculator checklist:
If your all-in friction exceeds 0.50% on a standard liquid trade, stop and optimize your route. In the world of crypto, cost efficiency is the ultimate compounding superpower.