Picture this classic trading scenario:
You are monitoring Ethereum on a mid-sized crypto exchange. The ticker proudly displays $3,400.00.
You decide to enter a long position with $100,000, click the green "Buy Market" button, and wait for confirmation.
When your order confirmation receipt appears, you are shocked to discover that your average fill price was not $3,400.00—it was $3,485.40.
In a split second, you lost $2,511.76 (2.51%) of your purchasing power before the market even moved a millimeter.
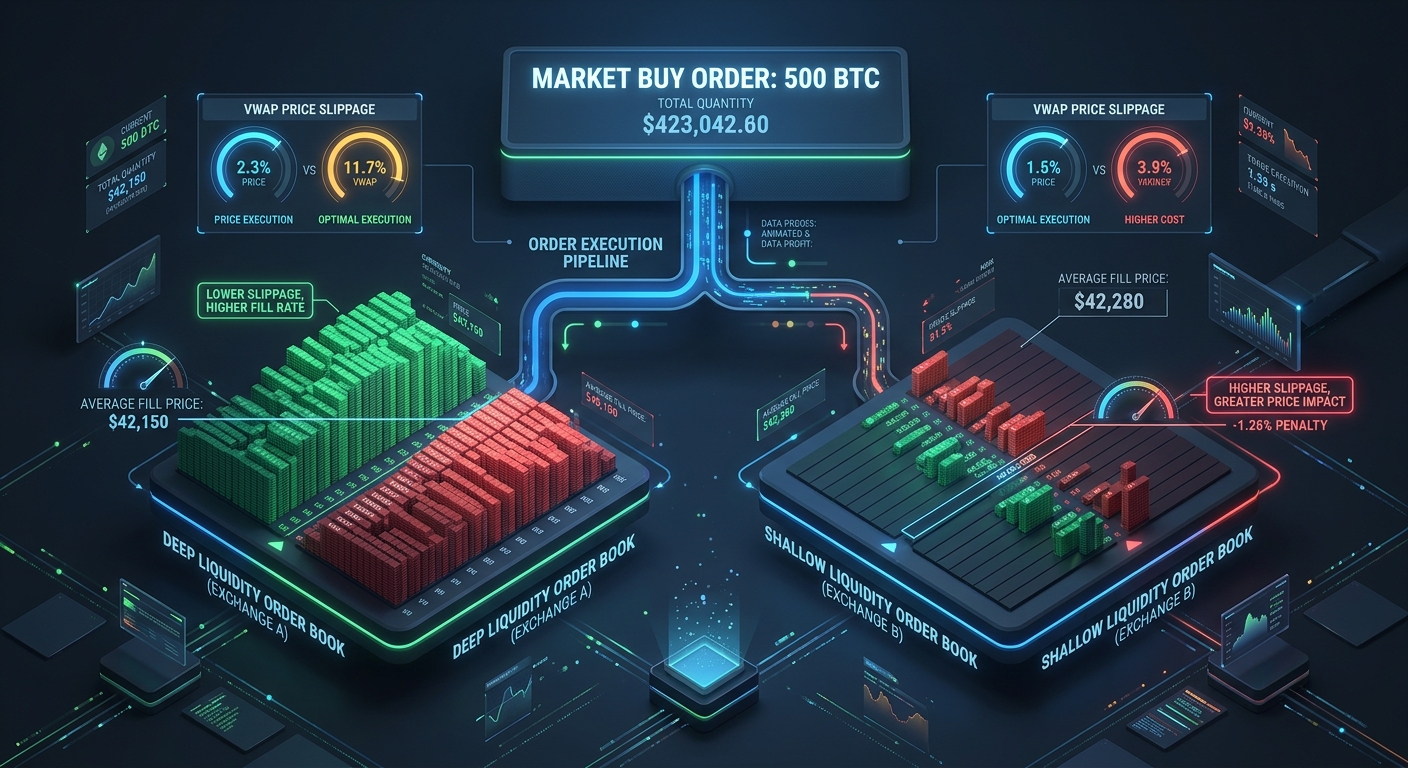
Where did your money go? You were not hacked, and the exchange did not charge an illegal hidden fee. You simply fell victim to Exchange Liquidity Deficit and Order Book Slippage.
The price you see on any crypto exchange is not a guaranteed retail catalog price. It is merely the price of the last matched trade between two past participants.
In this quantitative execution masterclass, we will deconstruct the mechanics of how exchange liquidity dictates your actual fill price, break down the mathematical equations of Volume-Weighted Average Price (VWAP) slippage, analyze liquidity depth across major global exchanges, and explore four real-world financial case studies.
The Swimming Pool Analogy: Deep vs. Shallow Liquidity
To build an intuitive grasp of exchange liquidity, think of market orders as stones thrown into bodies of water:
[ THE LIQUIDITY POOL PARADIGM ]

  1. DEEP INSTITUTIONAL EXCHANGE (The Olympic Pool)
     - Market Depth: $50,000,000 in resting limit orders
     - Dropping a 50kg boulder ($500,000 order) causes a 0.5mm ripple (0.01% slippage).
     - Fill Price: 99.99% identical to quoted ticker.

  2. SHALLOW / THIN EXCHANGE (The Bathtub)
     - Market Depth: $85,000 in resting limit orders
     - Dropping that same 50kg boulder displaces all the water and cracks the tub floor (15% slippage).
     - Fill Price: Catastrophically worse than quoted ticker.
When an exchange has deep liquidity, there is a dense wall of resting limit orders right behind the top price. When an exchange is shallow, the order book resembles a hollow ladder with huge empty gaps between price rungs.
1. The Anatomy of Order Execution: Walking the Book Ladder
When you submit an aggressive Market Buy Order, the exchange matching engine matches your order sequentially against resting Sell Limit Orders (Asks) from lowest price to highest price:
[ RESTING ASK ORDER BOOK LADDER ]

  Level 4: Ask Price: $3,450.00  |  Available: 15.0 ETH  ($51,750)
  Level 3: Ask Price: $3,425.00  |  Available: 10.0 ETH  ($34,250)
  Level 2: Ask Price: $3,410.00  |  Available:  5.0 ETH  ($17,050)
  Level 1: Ask Price: $3,400.00  |  Available:  2.0 ETH  ( $6,800) <--- QUOTED TICKER PRICE
--------------------------------------------------------------------------------------
  [ INCOMING $100,000 MARKET BUY ORDER PICKS UP LIQUIDITY LEVEL BY LEVEL ]

  Step 1: Consumes 2.0 ETH at $3,400.00 =  $6,800 spent (Leaves $93,200)
  Step 2: Consumes 5.0 ETH at $3,410.00 = $17,050 spent (Leaves $76,150)
  Step 3: Consumes 10.0 ETH at $3,425.00 = $34,250 spent (Leaves $41,900)
  Step 4: Consumes 12.14 ETH at $3,450.00 = $41,900 spent (Order Filled!)
--------------------------------------------------------------------------------------
  TOTAL ETH ACQUIRED: 29.14 ETH
  AVERAGE FILL PRICE (VWAP): $100,000 / 29.14 = $3,431.71
  SLIPPAGE PENALTY: +$31.71 per ETH (+0.93% loss on execution)
Even though the quoted price was $3,400.00, only $6,800 of your trade executed at that price. The remaining $93,200 was forced to "walk the book" up to $3,450.00.
2. The Core Mathematical Formulas for Fill Price & Slippage
Quantitative trading desks model fill prices using three fundamental mathematical equations:
Formula 1: Volume-Weighted Average Fill Price (VWAP)
VWAP = \frac{\sum_{i=1}^{k} ≤ft(P_i × q_i\right)}{\sum_{i=1}^{k} q_i} = (Total Capital Spent) / (Total Units Acquired)Where $P_i$ is the price at level $i$, and $q_i$ is the quantity filled at that specific price level.
Formula 2: Realized Slippage Dollar Penalty
Slippage ($) = |Actual Capital Spent - ≤ft(Units Acquired × P_{quoted}\right)|Formula 3: Slippage Percentage Drag
Slippage (%) = |\frac{VWAP - P_{quoted}}{P_{quoted}}| × 100If your quoted price was $3,400 and your VWAP was $3,431.71, your slippage percentage is $\frac{3,431.71 - 3,400}{3,400} × 100 = 0.9328\%$.
Multi-Exchange Liquidity Benchmark on a $250,000 Market Order
| Cryptocurrency Exchange | 1% Order Book Depth (ETH) | Quoted Ticker Price | Realized VWAP on $250k Order | Total Slippage Dollar Cost | Effective Slippage % |
|---|---|---|---|---|---|
| Binance (Global) | $35,000,000+ | $3,400.00 | $3,400.28 | -$20.58 | 0.0082% (Negligible) |
| Coinbase Advanced | $12,000,000 | $3,400.00 | $3,400.85 | -$62.48 | 0.0250% (Ultra-Low) |
| Kraken Pro | $6,500,000 | $3,400.00 | $3,401.60 | -$117.58 | 0.0470% (Very Low) |
| Bybit Spot | $5,200,000 | $3,400.00 | $3,402.15 | -$157.98 | 0.0632% (Low) |
| Uniswap v3 (0.05% Pool) | $8,000,000 | $3,400.00 | $3,401.80 | -$132.28 | 0.0529% (Low) |
| Tier-2 Regional Exchange | $280,000 | $3,400.00 | $3,462.50 | -$4,512.60 | 1.8382% (Severe Drag) |
| Low-Cap Altcoin Exchange | $45,000 | $3,400.00 | $3,845.00 | -$32,925.00 | 13.088% (Catastrophic) |
Real-World Case Study 1: The $50,000 Altcoin Market Buy (Deep CEX vs. Thin DEX)
A trader wanted to accumulate $50,000 of a trending Layer-1 token trading at $25.00:
Execution Venue A: Tier-1 Exchange (Binance/Bybit with $3.5M Depth)
Execution Venue B: Unrouted DEX AMM Pool with $90,000 Total Liquidity
The Financial Difference: Executing on the liquid venue gave the trader 301.25 more tokens (worth $7,531.25) on the exact same $50,000 capital outlay.
Real-World Case Study 2: The Arbitrageur's False Profit Mirage ($15,000 Capital)
A quantitative bot scanned cross-exchange prices for Solana:
The Quantitative Lesson: Without evaluating order book depth, high gross price spreads are frequently deceptive liquidity traps.
Real-World Case Study 3: The Microstructure Cascade — How Low Liquidity Triggers Flash Liquidations
In derivatives and leveraged margin markets, liquidity depth is the only barrier against liquidation cascades:
Real-World Case Study 4: Algorithmic TWAP Execution ($500,000 Saved)
A crypto venture fund needed to liquidate $2,000,000 of Bitcoin without disrupting the market:
By utilizing algorithmic liquidity pacing, the fund saved $25,800.00 in execution drag.