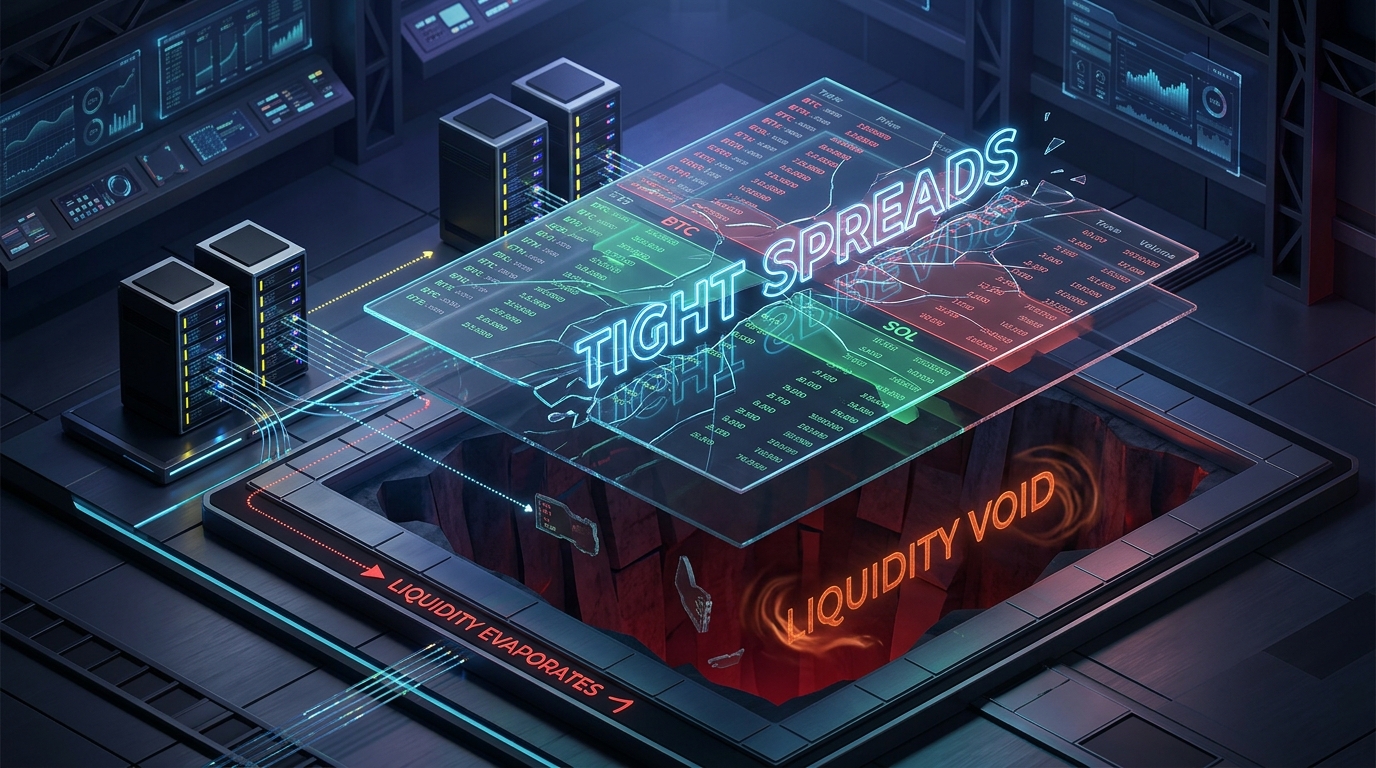
Look at your favorite cryptocurrency exchange trading terminal right now.
Bitcoin is quoting a Best Bid of $68,420.10 and a Best Ask of $68,420.20.
A microscopic $0.10 spread (0.00014%) separating buyers and sellers.
To the naked eye, this looks like the pinnacle of financial engineering. It gives you the comforting impression of a calm, frictionless, multi-billion-dollar ocean of liquidity where you can buy or sell millions at the exact price flashing on your screen.
It is an elaborate mathematical illusion.
Behind that pristine 10-cent spread lies a fragile, paper-thin facade engineered by algorithmic High-Frequency Trading (HFT) market makers. The moment a real institutional order hits the book—or market volatility spikes by even 1.5%—that microscopic spread dissolves into a 400-dollar abyss of slippage.
In this quantitative deep dive, we pull back the curtain on how institutional market makers fabricate the illusion of tight spreads, examine the mathematics governing their automated quote engines, and map the exact microstructural triggers that cause crypto liquidity to vaporize in milliseconds.
1. The Anatomy of the 1-Cent Spread: Top-of-Book Theater
To understand why retail traders get crushed by slippage on "tight" markets, you must distinguish between Surface Spread (BBO) and Effective Market Depth.
[ THE TOP-OF-BOOK LIQUIDITY ILLUSION ]

  WHAT YOUR SCREEN SHOWS:
  ---------------------------------------------------------------------------------
  Best Bid: $68,420.10  |  Best Ask: $68,420.20  ->  Spread: $0.10 (0.00014%)
  Verdict: "Super Tight & Ultra Liquid!"

  WHAT THE ORDER BOOK ACTUALLY CONTAINS UNDERNEATH:
  ---------------------------------------------------------------------------------
  Level 1 (Best Ask): $68,420.20  |  Size: 0.008 BTC  ($547.36)   <- The Holographic Bait!
  Level 2:            $68,495.00  |  Size: 0.040 BTC  ($2,739.80)  (+0.11% worse)
  Level 3:            $68,620.00  |  Size: 0.120 BTC  ($8,234.40)  (+0.29% worse)
  Level 4:            $68,950.00  |  Size: 0.450 BTC  ($31,027.50) (+0.77% worse)
  Level 5:            $69,400.00  |  Size: 1.200 BTC  ($83,280.00) (+1.43% worse)
  ---------------------------------------------------------------------------------
  REALITY: A $50,000 Market Buy sweeps to $69,400 -> REAL SPREAD/SLIPPAGE = +1.43% ($980.00!)
The market maker posted just $547.36 worth of Bitcoin at the best ask. That tiny $547 quote was enough to claim the top-of-book headline, satisfy their exchange Market Maker Program SLA (Service Level Agreement), and display a green "ultra-tight" badge on CoinMarketCap and CoinGecko.
The moment you submit a modest $50,000 market buy, your order devours that $547 thimble and sweeps deep into the barren book, filling your trade at an average price of $69,185—nearly $800 higher than the quote on your screen.
2. The Mathematics of Market Making: The Avellaneda-Stoikov Engine
Why do market makers quote so thinly at the top of the book? Why don't they leave $5,000,000 of resting liquidity right at the mid-price?
Because market makers are not investors. They do not want to hold cryptocurrency. They are statistical arbitrageurs whose sole objective is to earn the bid-ask spread and exchange maker rebates while maintaining zero directional inventory risk.
Institutional market making algorithms (such as Wintermute, Jump Trading, and Flow Traders) are powered by variations of the classic Avellaneda-Stoikov Market Microstructure Model:
[ THE AVELLANEDA-STOIKOV INVENTORY SKEW EQUATION ]

  Reservation Price (r):
  r(s, q, t) = s - q * γ * σ² * (T - t)

  Where:
  - s = Current Mid-Market Reference Price
  - q = Market Maker's Current Inventory (Positive = Long, Negative = Short)
  - γ = Risk-Aversion Parameter of the Algorithm
  - σ = Asset Volatility
  - (T - t) = Time Horizon to Session Rebalancing
From this reservation price, the algorithm calculates the optimal distance to post its optimal ask ($\delta^a$) and optimal bid ($\delta^b$):
\delta^a + \delta^b = \gamma \sigma^2 (T - t) + (2) / (\gamma) \ln≤ft(1 + (\gamma) / (\kappa)\right)[ HOW INVENTORY SKEW DESTROYS SYMMETRIC SPREADS ]
SCENARIO: Market Maker gets filled on a 50 BTC Buy Order (Now OVER-INVENTORIED):
- Algorithm immediately lowers its reservation price (r < s).
- Bid Quote: Pushed deep down to $67,800 (MM DOES NOT WANT TO BUY MORE!).
- Ask Quote: Pushed ultra-close to $68,430 with heavy size (MM DESPERATELY WANTS TO SELL!).
---------------------------------------------------------------------------------
RESULT: The spread on the buy side completely vanishes, leaving retail bids exposed to a vacuum.When an inventory imbalance occurs, the market maker does not defend both sides of the book equally. They intentionally drop their bids into the floor, creating an asymmetric liquidity cliff.
3. Phantom Liquidity & Quote Stuffing: The 200-Millisecond Shell Game
One of the least understood phenomena in modern electronic markets is Quote Churn.
If you analyze raw Level-3 market data feeds (the complete FIX / ITCH message log) from Coinbase or Binance, you discover an astonishing statistical fact:
Over 94% of all limit orders placed on cryptocurrency order books are canceled within 250 milliseconds without ever trading.
[ THE QUOTE CHURN WATERFALL (1 SECOND IN AN HFT ORDER BOOK) ]

  Time (ms)    Action                     Price        Size        Intent
  ------------------------------------------------------------------------------------------
  T + 0 ms     MM Engine places Buy Limit $68,420.10   1.5 BTC     Establish top-of-book presence
  T + 45 ms    No taker hits the quote    $68,420.10   1.5 BTC     Order is resting
  T + 90 ms    Binance BTC futures tick up by $2.00                 MM detects micro-drift
  T + 98 ms    MM sends CANCEL order      $68,420.10   1.5 BTC     ORDER CANCELED (Gone!)
  T + 104 ms   MM places new Buy Limit    $68,422.10   1.5 BTC     Re-quote at higher level
  ------------------------------------------------------------------------------------------
  RESULT: The liquidity was never permanent. It was a moving target dancing ahead of retail flow.
This is known as Phantom Liquidity. The quotes you see on the depth chart are not firm commitments to trade; they are fleeting micro-probes designed to fish for retail taker flow while remaining ready to cancel at the speed of light if toxic institutional volume appears.
The Master Diagnostic: Tight Spread vs. Real Liquidity Matrix
The table below compares the superficial appearance of tight spreads against genuine deep liquidity:
| Microstructure Metric | Superficial "Tight Spread" Illusion | Genuine Institutional Deep Liquidity |
|---|---|---|
| Top-of-Book Spread | 0.01% to 0.03% (Looks pristine) | 0.02% to 0.05% (Stable & honest) |
| Depth at ±1.0% Price Band | Less than $50,000 total volume | Over $5,000,000 continuous volume |
| Quote-to-Trade Ratio | > 120 : 1 (99% cancellations) | < 15 : 1 (High fill execution) |
| Behavior During News Volatility | Spreads blow out by 300x to 1,000x | Spreads widen moderately by 1.5x to 3x |
| Average Slippage on $100k Order | -2.4% to -4.8% (Severe drawdown) | -0.08% to -0.22% (Minimal drift) |
| Order Lifetime Half-Life | Under 120 milliseconds | 5 to 60+ seconds |
| Market Maker Type | Single mercenary HFT running rebate scripts | Multiple diversified institutional liquidity syndicates |
4. The Anatomy of a Break: When the Illusion Evaporates
When does this fragile facade shatter? When does a 0.01% spread turn into a 5% catastrophic liquidation vacuum?
It breaks during Structural Volatility Shocks through a four-stage domino effect:
[ THE 4 PHASES OF A LIQUIDITY EVAPORATION EVENT ]

  PHASE 1: THE CATALYST TRIGGER (T + 0.00s)
  - US CPI print beats expectations OR a $250M perpetual liquidation cascade initiates.

  PHASE 2: THE TOXIC FLOW DETECTION (T + 0.05s)
  - Inbound market taker orders are 99% one-sided (all aggressive market sells).
  - Market maker algorithms identify "Adverse Selection" (Informed Toxic Flow).

  PHASE 3: THE AUTOMATED FLIGHT TO SAFETY (T + 0.12s)
  - Market maker risk governors hit maximum threshold: `IF adverse_flow > X THEN CANCEL_ALL_BIDS`.
  - Within 40 milliseconds, ALL market makers withdraw their resting buy limit orders simultaneously.

  PHASE 4: THE VACUUM & FLASH SPIKE (T + 0.35s)
  - With no resting bids between $68,400 and $65,200, retail stop-losses and liquidation engines
    sweep into an EMPTY ORDER BOOK.
  - Price flashes down -5.0% in less than 1 second.