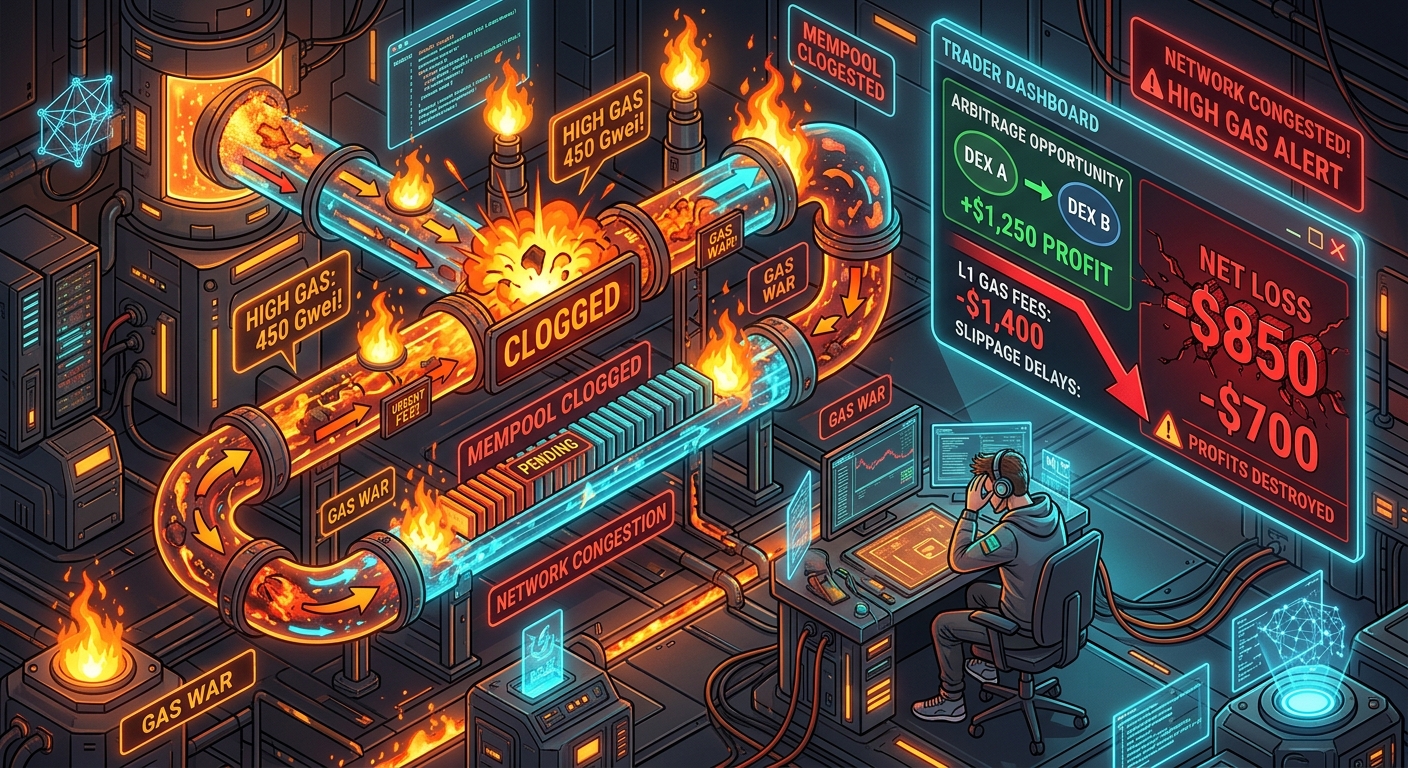
It is the classic rite of passage for every aspiring cryptocurrency arbitrageur:
You spot a juicy 2.5% price discrepancy on Ethereum.
A trending altcoin is trading at $100 on Coinbase, but over on Uniswap, an illiquid pool is lagging behind at $97.50.
Your mental math fires off instantly: Buy $10,000 worth on Uniswap for $97.50, transfer to Coinbase, sell for $100, and pocket an effortless $250 profit in five minutes.
You approve the contract, smash the swap button, and wait.
Ten minutes later, the dust settles. You open your block explorer and your exchange account to tally the spoils—only to discover that your $10,000 is now $9,820.
You didn't make $250. You lost $180.
Where did the money go? Did the price move? Did someone front-run you? Or did the silent tax of blockchain network congestion and gas fees cannibalize your entire trade?
In this forensic guide, we dissect the mechanics of on-chain execution costs, examine why nominal spreads are deeply deceptive, and provide the exact mathematical formulas needed to calculate true net profitability before executing a single transaction.
1. The Anatomy of On-Chain Gas Drag
In centralized exchange (CEX) arbitrage, trading fees are strictly proportional (percentage-based, e.g. 0.05% maker / 0.10% taker). If you trade $100 or $1,000,000, the fee percentage remains constant.
In decentralized (DEX) and on-chain arbitrage, however, gas fees operate as fixed computational overhead:
[ THE FIXED GAS vs. PROPORTIONAL SPREAD PARADOX ]

  Scenario: Ethereum gas price surges to 80 Gwei during high network congestion.
  Complex Smart Contract Swap (Uniswap v3 + Routing): ~185,000 Gas Units.
  Total Gas Cost = 185,000 × 80 Gwei × ($3,500 ETH) = $51.80 per transaction!

  Case A (Small Trader - $1,000 Trade with 2.0% Spread):
    • Gross Profit Spread:      +$20.00
    • On-Chain Gas Cost:        -$51.80
    • NET OUTCOME:              -$31.80  (DEVASTATING -159% NET LOSS!)

  Case B (Institutional Fund - $100,000 Trade with 2.0% Spread):
    • Gross Profit Spread:      +$2,000.00
    • On-Chain Gas Cost:        -$51.80
    • NET OUTCOME:              +$1,948.20 (HIGHLY PROFITABLE +97.4% MARGIN!)
Because gas is a flat overhead cost rather than a percentage, small-to-midsize retail trades are statistically doomed during periods of network congestion, while institutional capital operates with massive structural economies of scale.
2. The 4 Hidden Ways Congestion Destroys Arbitrage Spreads
Gas fees do not just nibble at your profits—network congestion attacks your trade across four distinct vectors:
[ THE 4 CONGESTION TRAPS ]

  1. EIP-1559 EXPONENTIAL BASE FEE SURGE (12.5% compounded per block)
  2. PRIORITY GAS AUCTIONS (PGA) & MEV FRONT-RUNNING BRIBES
  3. THE REVERTED TRANSACTION TRAP (100% gas burned with zero trade execution)
  4. IN-TRANSIT SLIPPAGE & BRIDGE SETTLEMENT FREEZES
1. The Exponential Base Fee Surge (EIP-1559)
Under Ethereum’s EIP-1559 mechanism, when network demand exceeds the target block capacity of 15 million gas, the base fee increases by 12.5% every single block (12 seconds).
If a sudden market panic or popular token launch fills blocks to 100% capacity:
• Block 1: 30 Gwei (~$15 swap)
• Block 5: 54 Gwei (~$27 swap)
• Block 10: 97 Gwei (~$48 swap)
• Block 20: 314 Gwei (~$157 swap!)
In less than four minutes, the cost to interact with a smart contract multiplies by over 1,000%, turning previously profitable spreads into deep negative expected value (-EV) traps.
2. Priority Gas Auctions (PGA) & The "Searcher Tax"
When an attractive on-chain price discrepancy appears, you are not competing against other humans—you are competing against institutional Maximal Extractable Value (MEV) searcher bots.
These bots run automated simulations and participate in Priority Gas Auctions (PGA) or Flashbots private bundles.
If an arbitrage opportunity is worth $1,000, a bot will bid $950 in priority gas bribes directly to the block validator to ensure their transaction is placed first in the block. The bot walks away with $50 in risk-free profit, while any manual trader attempting the trade gets front-run or stuck in the queue.
3. The Reverted Transaction Penalty
What happens if an arbitrage bot front-runs you, or the price on Uniswap moves before your transaction confirms?
Your smart contract transaction fails and reverts (due to slippage protection).
However, the Ethereum Virtual Machine (EVM) still executed the computational instructions up to the point of failure. You must still pay 100% of the gas fee for the failed transaction.
Traders frequently wake up to find three consecutive failed swaps that drained $150 in ETH from their wallet without purchasing a single token.
4. The Cross-Chain Bridge Transit Freeze
Many traders attempt cross-chain arbitrage: buying on an Ethereum Layer-2 (Arbitrum/Optimism/Base) and selling on Ethereum Layer-1 or another chain.
During major market crashes, bridge relayers and RPC nodes become overwhelmed. A transfer that usually takes 60 seconds can get stuck in a bridge queue for 45 minutes.
By the time your tokens unlock on the destination exchange, the arbitrage price gap has vanished, leaving you with open directional exposure in a collapsing market.
3. The Complete Net Profit Formula
To ensure you never execute an unprofitable trade, your execution logic must compute Net Expected Value (Net EV), not Gross Spread:
[ TRUE ARBITRAGE PROFIT FORMULA ]

  Net Profit = (Capital × Gross Spread %)
               - [ (Capital × CEX Taker Fee %)
                 + (Capital × DEX Swap Fee %)
                 + (Gas Units × Gas Price × Native Token Price)
                 + (CEX Withdrawal / Deposit Fee)
                 + (Expected Slippage Impact %) ]
4. Break-Even Capital Threshold Matrix
The following table illustrates the minimum capital required to achieve break-even on a 1.5% gross price spread across various network congestion regimes:
| Network Congestion | Avg Gas Price (Gwei) | On-Chain Swap Cost ($) | Min. Trade Size for Break-Even (at 1.5% Spread) | Net Profit on $10,000 Trade |
|---|---|---|---|---|
| Low Congestion (Quiet Night) | 12 Gwei | ~$7.50 | $650 | +$112.50 (1.13% Net) |
| Moderate Traffic | 35 Gwei | ~$22.00 | $1,900 | +$98.00 (0.98% Net) |
| High Congestion (Market Breakout) | 85 Gwei | ~$55.00 | $4,800 | +$65.00 (0.65% Net) |
| Extreme Gas Spike (Meme Craze / Crash) | 220 Gwei | ~$140.00 | $12,200 | -$20.00 (NET LOSS!) |
5. Execution Summary & Risk Mitigation Checklist
To insulate your trading strategy against network congestion drag, apply these operational safeguards: