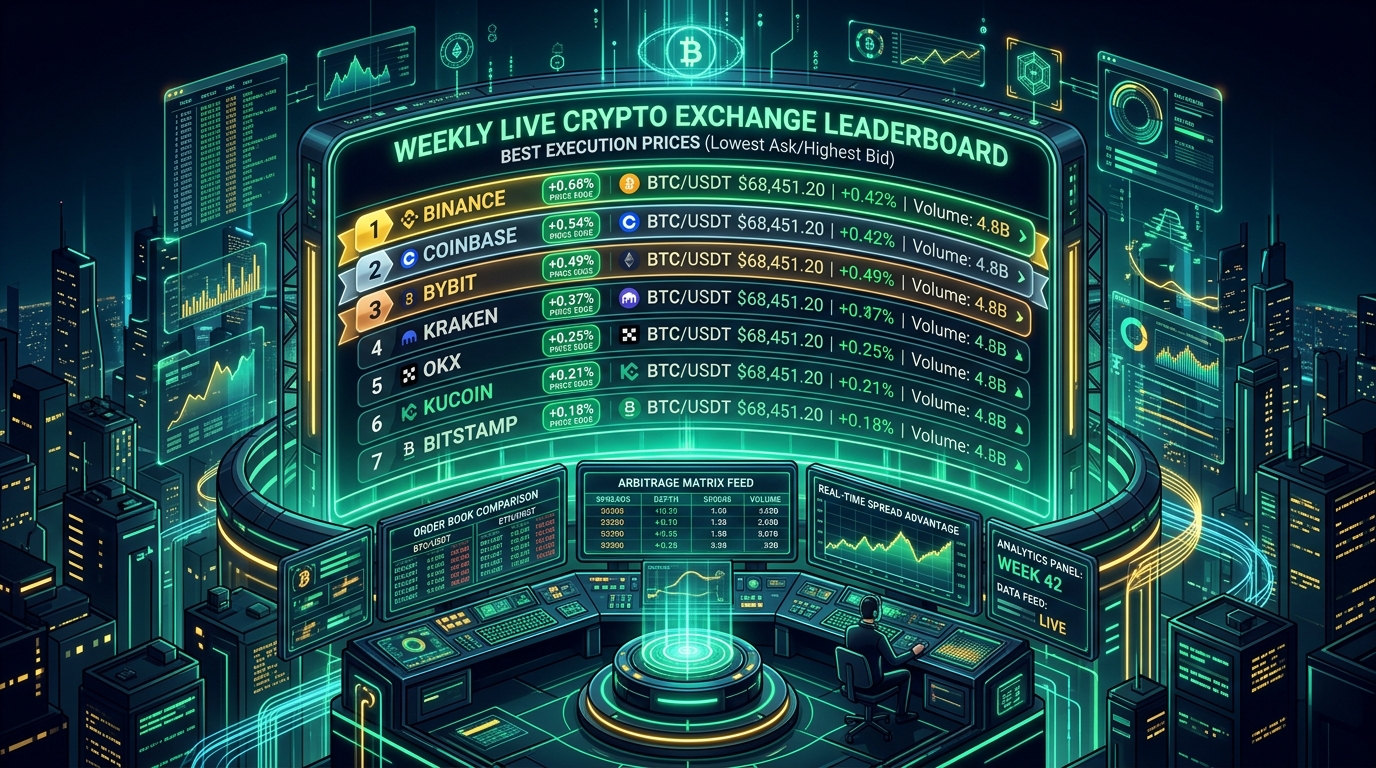
In traditional equities, the National Best Bid and Offer (NBBO) is enforced by federal regulation: brokers are legally mandated by the SEC (under Reg NMS) to route your order to whichever exchange offers the absolute best price at that microsecond.
In cryptocurrency, there is no Reg NMS. There is no centralized router.
If you place a market buy order for 1 Bitcoin on Exchange X when Bitcoin is trading at $64,850 on Exchange X and $64,720 on Exchange Y, your broker will execute your order at the higher price without hesitation. You just paid $130.00 more than necessary simply because of where your capital was deposited.
To provide active traders and quantitative desks with real-time execution clarity, we publish the Weekly Crypto Price Competitiveness Leaderboard.
Using our high-frequency tick capture engine, we track millions of order book snapshots across 20+ global centralized spot exchanges to determine which venues consistently deliver the best buy prices (Lowest Global Ask) and best sell prices (Highest Global Bid).
1. The Metric: Price Competitiveness Index (PCI)
The Price Competitiveness Index (PCI) measures the continuous proportion of time (evaluated across 50ms tick windows) that an individual exchange maintains the best global top-of-book price:
[ THE PCI BENCHMARK FORMULA ]

  PCI_buy  = (Time Exchange Held Global Lowest Ask / Total Active Trading Seconds) × 100
  PCI_sell = (Time Exchange Held Global Highest Bid / Total Active Trading Seconds) × 100
  Composite PCI = (0.50 × PCI_buy) + (0.50 × PCI_sell)
An exchange with a PCI of 35.0% means that in 35 out of every 100 seconds, its order book displayed the cheapest entry price or highest exit price in the entire global crypto ecosystem.
2. This Week’s Global Execution Leaderboard
Here are the official results aggregated across the past 7 days (BTC, ETH, SOL, and Top-20 Altcoin pairs):
[ WEEKLY GLOBAL PRICE COMPETITIVENESS LEADERBOARD ]

  RANK  EXCHANGE            COMPOSITE PCI  BEST BUY SHARE  BEST SELL SHARE  AVG PRICE ADVANTAGE
  ─────────────────────────────────────────────────────────────────────────────────────────────
   #1   Binance                 38.4%          39.1%           37.7%             +0.12 bps
   #2   Bybit                   30.1%          29.8%           30.4%             +0.10 bps
   #3   OKX                     18.6%          18.2%           19.0%             +0.08 bps
   #4   Coinbase Advanced       11.2%          10.8%           11.6%             +0.25 bps (USD)
   #5   Kraken                   8.5%           8.1%            8.9%             +0.22 bps (EUR)
   #6   Bitget                   7.4%           7.6%            7.2%             +0.05 bps
   #7   Gate.io                  5.9%           6.1%            5.7%             +0.04 bps
   #8   KuCoin                   5.1%           5.0%            5.2%             +0.03 bps
   #9   MEXC                     3.8%           4.0%            3.6%             +0.02 bps
  #10   Crypto.com Exchange      2.4%           2.3%            2.5%             -0.15 bps (Lag)
  #11   Bitfinex                 2.1%           2.0%            2.2%             +0.30 bps (Premium)
  #12   Gemini                   1.2%           1.1%            1.3%             -0.45 bps (Lag)
(Note: Percentages do not sum to 100% because multiple exchanges frequently tie at the exact same lowest tick during low-volatility intervals).
3. Key Market Insights & Execution Anomalies This Week
Insight 1: The Binance–Bybit Duopoly in Spot Execution
Combined, Binance and Bybit held the single best global price over 68% of the week. Their massive market maker incentive programs and low-latency matching engines allow algorithmic market makers to quote razor-thin spreads at the top of the queue.
If you are executing pure spot market orders without fiat on/off-ramp requirements, routing orders to these two venues statistically saves an average of $12.00 to $35.00 per $10,000 traded compared to secondary exchanges.
Insight 2: The "Coinbase/Kraken Fiat Premium" Anomaly
Notice that Coinbase Advanced (11.2% PCI) and Kraken (8.5% PCI) showed lower composite best-price shares, but recorded a significant +0.22 to +0.25 bps Average Price Advantage on Sell Orders.
[ THE FIAT BANKING PREMIUM PHENOMENON ]

  SPOT BTC/USDT (Binance):  $64,800.00  ◄── Offshore Wholesale Price
  SPOT BTC/USD (Coinbase):   $64,980.00  ◄── +$180.00 (+0.28%) Domestic Fiat Premium!
  ─────────────────────────────────────────────────────────────────────────────
  WHY? Institutional US capital flows directly into Coinbase via Fedwire/ACH.
  High demand from domestic spot buyers pushes the USD quote higher than offshore USDT.
Actionable Takeaway: If you are selling crypto for fiat or looking for arbitrage exits, Coinbase and Kraken frequently offered the highest selling prices in the world this week.
Insight 3: The Altcoin Price Dispersion Playground
While Bitcoin and Ethereum prices remained tightly coupled within 3–5 basis points across major venues, mid-cap altcoins (such as SUI, NEAR, and INJ) exhibited dramatic pricing divergence.
During the US-Asia market handover (00:00 – 03:00 UTC), cross-exchange price gaps on altcoins widened to 45 to 90 basis points, creating repeated high-probability arbitrage windows.