If you hold $50,000 worth of Bitcoin or Ethereum and decide you want to exit your position into USDC right now, how long does it take?
About 400 milliseconds.
You open Binance, Coinbase, or Uniswap, click "Market Sell," and your capital is liquid with less than 0.05% in total market impact and exchange fees.
Now, suppose you hold a rare generative art NFT or Bored Ape valued at $50,000 (15 ETH).
You decide you want to cash out into USDC immediately.
What happens?
You look at the marketplace. The lowest listing (Floor Price) is 15 ETH. But the highest instant buyer (Top Collection Bid) is sitting at 12.8 ETH (-14.6% below floor!).
If you want your cash right now, you must accept an immediate $7,300 haircut. If you refuse, you must list at 14.9 ETH and wait days, weeks, or months—praying that another collector comes along before the market crashes further.
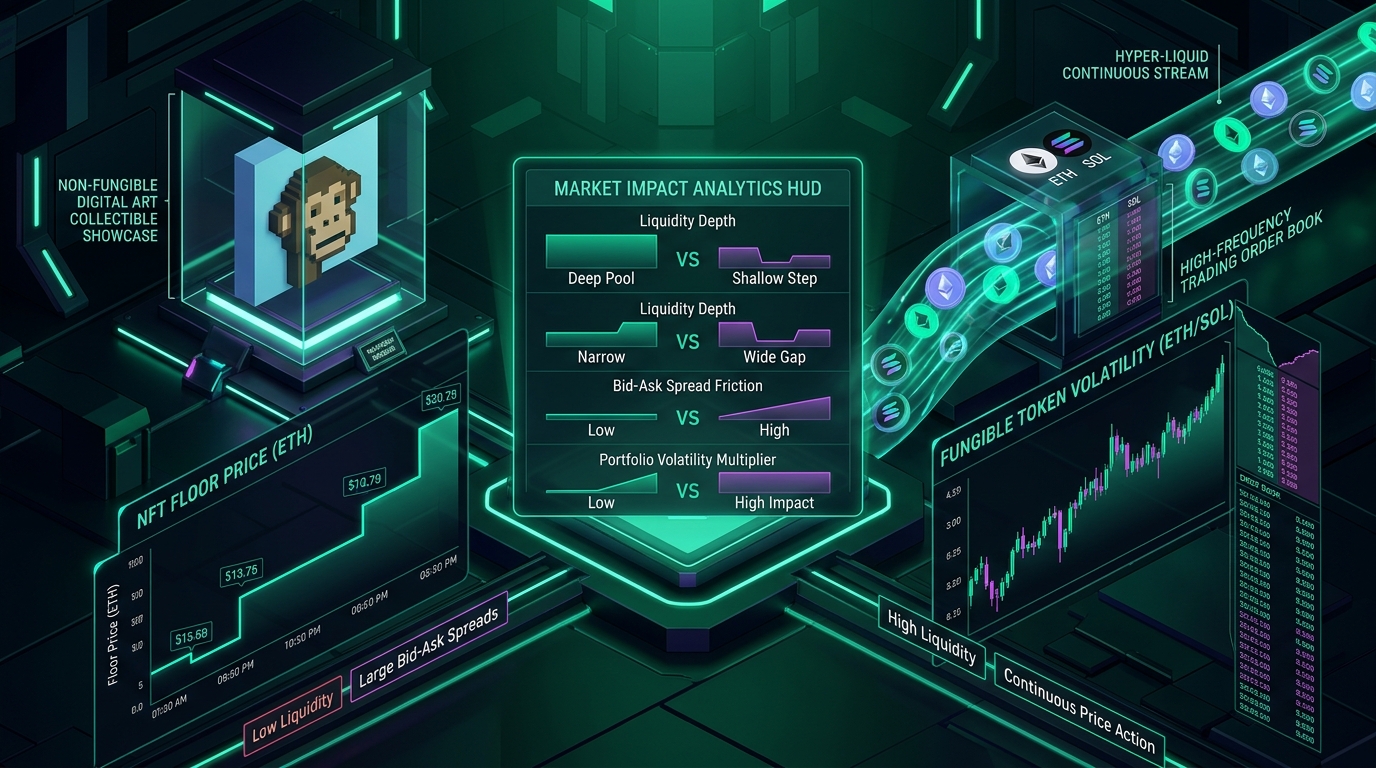
This stark contrast illustrates the fundamental truth of decentralized markets: Fungible tokens trade like liquid foreign exchange (Forex), while NFTs trade like illiquid beachfront real estate.
In this quantitative market microstructure guide, we explore why NFT floor prices behave so differently from ERC-20 token prices, dissect the mathematics of floor price volatility, and analyze the hidden risks of illiquid on-chain assets.
1. The Core Microstructure Divide: Continuous vs. Discrete Liquidity
The fundamental difference between fungible crypto tokens (BTC, ETH, SOL) and NFTs lies in their clearing mechanism:
[ CONTINUOUS ORDER BOOK vs. DISCRETE NFT MARKETPLACE ]

  FUNGIBLE TOKEN (ETH / USDT):            NON-FUNGIBLE TOKEN (PFP / DIGITAL ART):
  • Unit Nature:  100% Fungible & Divisible • Unit Nature:  Unique, indivisible ID (Token #4829)
  • Liquidity:    Continuous double-auction  • Liquidity:    Discrete unilateral listings & bids
  • Tick Size:    $0.01 increments          • Tick Size:    0.01 – 0.50 ETH gaps between listings
  • Trade Speed:  Microseconds (HFT bots)   • Trade Speed:  Hours to days per discrete transfer
  • Depth:        Millions in cumulative bids• Depth:        1 or 2 items at current floor price
Why Floor Price Is an Optical Illusion
On a cryptocurrency exchange, the "Spot Price" represents the price at which buyers and sellers are actively trading right now.
On an NFT marketplace (like OpenSea or Blur), the Floor Price is merely the lowest asking price of any currently listed item in the collection.
[ ANATOMY OF AN NFT FLOOR PRICE CLIFF ]

  COLLECTION SIZE: 10,000 NFTs | LISTED: 350 NFTs (3.5% of supply)

  CURRENT ASKS (LISTINGS):               CURRENT TOP BIDS (OFFERS):
  ┌─────────────────────────────┐        ┌─────────────────────────────┐
  │ NFT #1042:  10.00 ETH (FLOOR)│        │ Collection Bid:   8.20 ETH  │ ◄── -18.0% SPREAD GAP!
  │ NFT #8831:  10.15 ETH       │        │ Collection Bid:   8.15 ETH  │
  │ NFT #5402:  10.80 ETH       │        │ Collection Bid:   7.90 ETH  │
  │ NFT #9910:  12.50 ETH       │        │ User Bid #1204:   6.50 ETH  │
  └─────────────────────────────┘        └─────────────────────────────┘
Notice that if just two panic sellers undercut the floor and dump their items for 9.0 ETH, the official collection "Floor Price" instantly collapses from 10.00 ETH down to 9.00 ETH (-10.0%) on a trivial sales volume of only $50,000.
In a fungible token with $100M in liquidity, moving the market price by 10% requires millions of dollars in net capital outflow. In an NFT collection, a 10% floor crash can be caused by a single collector needing rent money.
2. The "Dual-Currency" Volatility Multiplier
One of the most dangerous, overlooked aspects of NFT valuation is that NFTs are almost always priced in a volatile native cryptocurrency (Ethereum or Solana) rather than stable fiat.
This creates a compounded volatility multiplier in USD terms:
Portfolio Value (USD) = NFT Floor Price (ETH) × ETH Spot Price (USD)[ THE DUAL-VOLATILITY COMPOUNDING TRAP ]
BULL MARKET SCENARIO (Upward Supercharger):
• Starting Point: Buy NFT at 10 ETH when ETH = $2,000 ──► Total Cost: $20,000
• NFT Floor rises from 10 ETH to 20 ETH (+100% in ETH terms)
• Simultaneously, ETH rises from $2,000 to $4,000 (+100% in USD terms)
• New Portfolio Value: 20 ETH × $4,000 = $80,000 (+300% USD Gain!)
BEAR MARKET SCENARIO (The Double-Whammy Crash):
• Starting Point: Hold NFT at 20 ETH when ETH = $4,000 ──► Peak Value: $80,000
• NFT Floor drops from 20 ETH to 10 ETH (-50% in ETH terms)
• Simultaneously, ETH crashes from $4,000 to $2,000 (-50% in USD terms)
• New Portfolio Value: 10 ETH × $2,000 = $20,000 (-75.0% USD Drawdown!)Because NFT demand is pro-cyclical with crypto wealth, floor prices in ETH terms tend to collapse at the exact same time that ETH itself crashes against the US Dollar.
A 50% drop in ETH and a 50% drop in collection floor price results in a catastrophic -75% dollar-denominated loss.
3. Exit Friction & The True Cost of Liquidity
When evaluating token vs. NFT volatility, traders must factor in transaction friction.
| Metric | Fungible Tokens (ETH / BTC) | Non-Fungible Tokens (NFTs) |
|---|---|---|
| Bid-Ask Spread | 0.01% – 0.05% | 5.0% – 20.0% (Floor vs. Collection Bid) |
| Marketplace Fees | 0.02% – 0.10% (CEX / DEX) | 0.5% – 2.5% (OpenSea / Blur) |
| Creator Royalties | 0% | 0.5% – 5.0% (Enforced on some venues) |
| Time to Instant Liquidity | Sub-second | Requires hitting lowball collection bids |
| Total Round-Trip Friction | ~0.10% | 8.0% – 25.0% |
If you buy and immediately sell an NFT without the floor price changing at all, you will lose 10% to 18% of your principal solely to marketplace platform fees, creator royalties, and the wide bid-ask spread.
4. Why NFT Floor Prices Lag Behind Market Realities
In a sudden market crash, fungible tokens react instantly: Bitcoin drops 8% in ten minutes as automated liquidations trigger across Bybit and Binance.
NFT collections, however, often show lagging, sticky prices for days or weeks. Why?
[ THE NFT LIQUIDITY FREEZE CYCLE ]

  1. MACRO CRYPTO CRASH OCCURS (ETH drops -15% in 4 hours)
     │
     ▼
  2. BUYERS RETRACT COLLECTION BIDS
     │ (Bids vanish or drop to extreme lowball discounts)
     ▼
  3. SELLERS REFUSE TO LOWER LISTINGS (Endowment Effect / Loss Aversion)
     │ (Owners refuse to sell below their purchase price)
     ▼
  4. TRADING VOLUME DIES TO ZERO (Market Freeze)
     │ (Reported Floor Price sits at 10 ETH, but zero trades occur for 5 days)
     ▼
  5. FIRST DESPERATE SELLER UNDERCUTS THE BOOK
     │ (Floor price abruptly plummets from 10 ETH to 6 ETH in a single print!)
This structural lag tricks inexperienced investors into thinking their NFT portfolio was "resilient" during the crash, when in reality the market was simply illiquid and frozen.
5. DeFi Lending & NFT Liquidation Cascades
With the rise of NFT financialization protocols (such as Blur Lending / Blend and BendDAO), NFTs became collateral for crypto loans.
This introduced a new volatility driver: Automated Liquidation Dutch Auctions.
6. Quantitative Strategy: Trading Across Liquidity Regimes
Whether you are trading fungible altcoins or evaluating digital asset portfolios, adhere to these four golden rules: