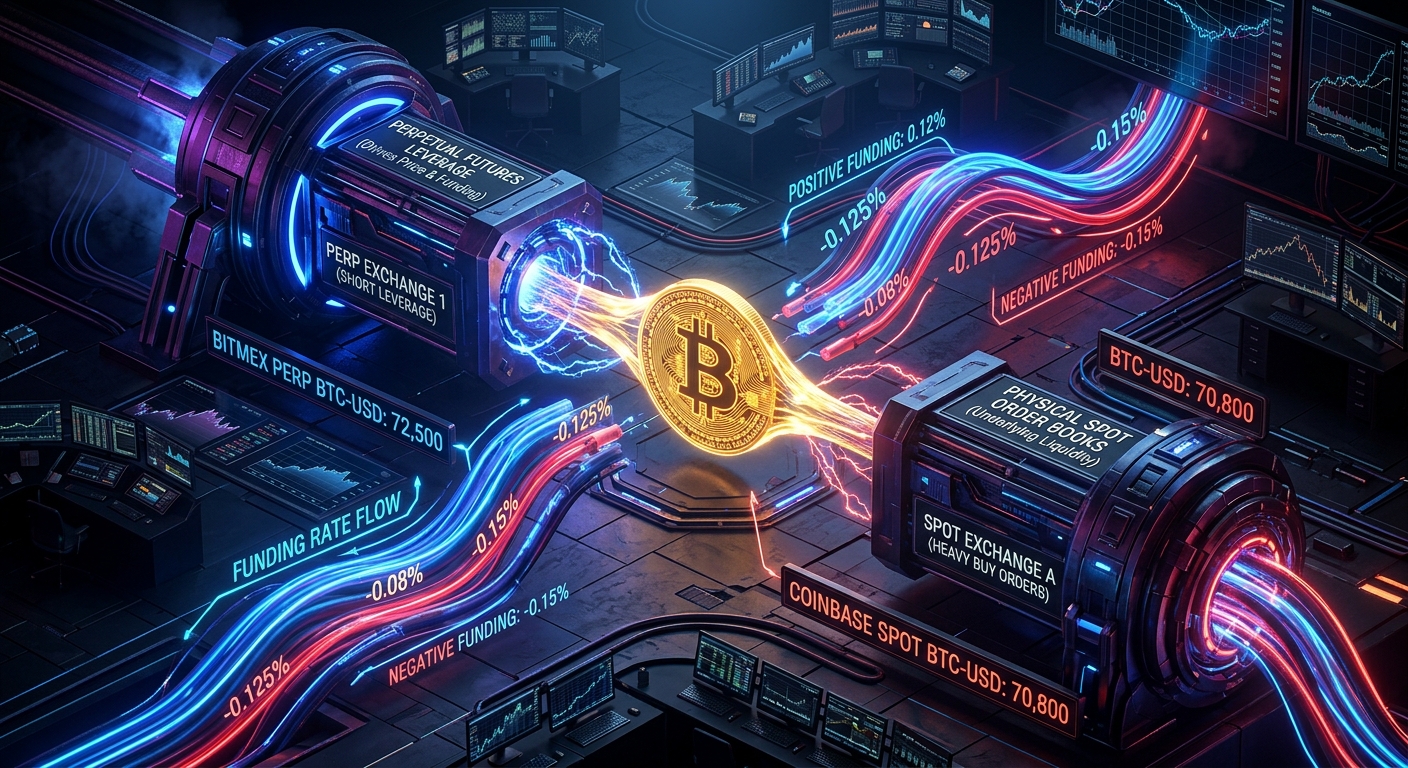
Look at Bitcoin’s price across two major exchanges during the peak of a high-volatility trading session.
On Binance, Bitcoin spot is quoting $69,450.00.
On Coinbase, Bitcoin spot is quoting $69,050.00.
A massive $400.00 price gap (0.58%) separating the world’s two largest cryptocurrency trading venues.
A naive trader looking at this chart will assume that US retail investors are sleeping, or that Coinbase is lagging behind global sentiment.
They are completely misunderstanding the microstructural physics of the market.
The reason Binance spot is trading $400 higher than Coinbase has nothing to do with Bitcoin’s spot supply or demand. It is being pulled upward by a massive, invisible financial tractor beam operating in the derivatives market: The Perpetual Futures Funding Rate Engine.
In this quantitative breakdown, we explore how perpetual futures funding rates act as the master transmission mechanism that pulls physical spot prices apart across global venues, dissect the mathematical architecture of the Cash-and-Carry basis arbitrage loop, and explain how traders can identify and trade basis dislocations.
1. The Mechanics of the Perpetual Anchor: Why Funding Rates Exist
Traditional futures contracts (like CME Bitcoin Futures or Crude Oil Futures) have fixed calendar expiration dates (March, June, September, December). As expiration approaches, the futures price naturally and mathematically converges to the underlying spot index.
Perpetual Futures (Perps), invented by BitMEX in 2016, never expire. You can hold a 50x leveraged long position for five years without rolling contracts.
Without an expiration date, how does an exchange prevent the perpetual futures price from drifting into outer space? Through the periodic Funding Rate settlement.
[ THE PERPETUAL FUNDING RATE EQUATION ]

  Funding Rate (F) = Clamp(Premium Index (P) + Clamp(Interest Rate (I) - Premium Index (P), -0.05%, +0.05%), Min_Rate, Max_Rate)

  Where the Premium Index (P) measures the divergence between Futures and Spot:
  P = (Max(0, Impact Bid Price - Index Price) - Max(0, Index Price - Impact Ask Price)) / Index Price

  THE SETTLEMENT RULE:
  - If Perp Price > Spot Price (F > 0): LONGS PAY SHORTS (Disincentivizes excessive bullish leverage).
  - If Perp Price < Spot Price (F < 0): SHORTS PAY LONGS (Disincentivizes excessive bearish leverage).
Every 8 hours (at 00:00, 08:00, and 16:00 UTC), every open perpetual position settles funding cash flows directly between traders’ margin balances.
2. The Transmission Mechanism: How Perps Pull Spot Prices Apart
How does a funding fee between two futures traders on Binance cause spot Bitcoin on Binance to trade at a $400 premium over spot Bitcoin on Coinbase?
The answer is The Cash-and-Carry Basis Arbitrage Desk.
[ THE CASH-AND-CARRY TRANSMISSION ENGINE ]

  STEP 1: THE DERIVATIVES LEVERAGE TSUNAMI (Binance Futures)
          - Retail and degen hedge funds flood into 20x Long BTC/USDT Perps.
          - Perp price surges to $70,200 while Spot Index is $69,000.
          - Funding Rate skyrockets to +0.12% per 8 hours (+131.4% Annualized APR!).

  STEP 2: THE INSTITUTIONAL CAPITAL RESPONSE (Basis Quants)
          - Quantitative prop desks (Wintermute, Jane Street, FalconX) spot a +131% risk-free yield.
          - To capture this yield delta-neutral, the desk must:
            1. SHORT $500,000,000 of BTC/USDT Perpetual Futures at $70,200.
            2. Simultaneously BUY $500,000,000 of PHYSICAL BTC SPOT to hedge directional risk.

  STEP 3: THE LOCAL SPOT AGGRESSION
          - Where does the desk buy the $500M spot BTC? On the SAME venue (Binance) to minimize
            cross-margin liquidation risk and internal transfer latency!
          - Massive institutional TWAP/VWAP spot buy orders sweep the Binance spot order book.
          - Binance Spot is forcibly driven up from $69,000 to $69,450.

  STEP 4: THE CROSS-VENUE DISLOCATION
          - Coinbase (fiat-only, no perps) has NO native cash-and-carry buying pressure.
          - Coinbase Spot stays at $69,050.
          - RESULT: A $400 Cross-Exchange Spot Basis Spread opens up!
The basis desk does not care if Bitcoin goes to $100,000 or $10,000. Because they are simultaneously Long Spot and Short Perp, their delta is exactly 0.00. They simply collect the +0.12% cash payment every 8 hours, pocketing hundreds of thousands of dollars a day while physically dragging Binance spot prices away from Coinbase.
The Funding Rate vs. Spot Basis Dislocation Matrix
The table below illustrates how differing funding rate regimes distort spot price spreads between derivatives-heavy exchanges (Binance, Bybit) and fiat-spot exchanges (Coinbase, Kraken):
| Funding Rate Regime | 8-Hour Funding Rate | Annualized APR | Spot Basis Behavior (Derivatives CEX vs Fiat CEX) | Order Book Imbalance | Typical Market State |
|---|---|---|---|---|---|
| Extreme Euphoria | +0.15% to +0.30% | +164% to +328% APR | Derivatives Spot trades at +0.60% to +1.20% PREMIUM | Massive Spot Buy walls; Hollow Ask book | Parabolic Bull Run / ATH Breakout |
| Standard Bullish | +0.03% to +0.08% | +32.8% to +87.6% APR | Derivatives Spot trades at +0.10% to +0.25% Premium | Balanced two-way order flow | Steady Uptrend |
| Neutral Equilibrium | +0.01% (Baseline) | +10.95% APR | Spot Prices within ±0.02% across all venues | Perfect symmetric book depth | Ranging / Consolidation |
| Moderate Bearish | -0.02% to -0.06% | -21.9% to -65.7% APR | Derivatives Spot trades at -0.15% to -0.30% DISCOUNT | Spot Sell pressure; Heavy Asks | Steady Downtrend |
| Extreme Capitulation | -0.10% to -0.35% | -109% to -383% APR | Derivatives Spot trades at -0.80% to -2.50% DISCOUNT | Aggressive Spot dumping to buy Perps | Flash Crash / Liquidation Cascade |
3. The Negative Funding Inversion: When Spot Gets Dumped for Cheap Perps
What happens when market panic strikes and funding rates turn violently negative?
When crypto crashes, overleveraged bears pile into short perpetual positions, pushing perp prices significantly below spot prices.
The funding rate flips to -0.20% per 8 hours (meaning shorts must pay longs +219% APR just to keep their short positions open).
This triggers the Reverse Cash-and-Carry Arbitrage Loop:
[ THE REVERSE CASH-AND-CARRY SPIRAL ]

  1. Perp trades at $65,000 while Spot is $66,000 (Funding = -0.20% per 8hr).
  2. Quantitative desks execute the Reverse Basis Trade:
     - BUY 1,000 BTC of Perpetual Futures at $65,000 (Collecting the +0.20% funding fee from shorts!).
     - Simultaneously DUMP 1,000 BTC of Spot Bitcoin on Binance spot order books to hedge.
  3. This aggressive spot selling pushes Binance spot down to $65,200.
  4. Meanwhile, Kraken and Coinbase spot (unaffected by perp liquidation cascades) remain at $65,800.
  5. RESULT: Binance spot trades at a $600 DISCOUNT to Coinbase spot!
4. Real-World Case Studies: The Most Extreme Basis Distortions in History
Case Study 1: The March 2024 Bitcoin $73,000 All-Time High Cash-and-Carry Blowout
Case Study 2: The TRB (Tellor) December 2023 Funding Squeeze Dislocation
5. Cross-Venue Funding Arbitrage: The Delta-Neutral Spread Trade
Because different exchanges have different client demographics (e.g., Bybit is heavily weighted toward Asian retail traders, while OKX has strong European institutional flow), funding rates frequently diverge between exchanges for the exact same asset.
[ THE CROSS-VENUE FUNDING RATE ARBITRAGE EQUATION ]

  SCENARIO:
  - Binance SOL/USDT Perpetual Funding Rate = +0.09% per 8 hours (+98.5% APR)
  - Bybit SOL/USDT Perpetual Funding Rate   = +0.02% per 8 hours (+21.9% APR)

  THE EXECUTION:
  1. SHORT SOL/USDT Perp on Binance (Receive +0.09% funding from Binance longs).
  2. LONG SOL/USDT Perp on Bybit    (Pay -0.02% funding to Bybit shorts).
  ---------------------------------------------------------------------------------
  NET PROFIT = +0.09% - 0.02% = +0.07% Net Yield per 8 hours (+76.6% Delta-Neutral APR!)
  RISK: Pure exchange counterparty & margin liquidation risk (ZERO crypto price exposure!).