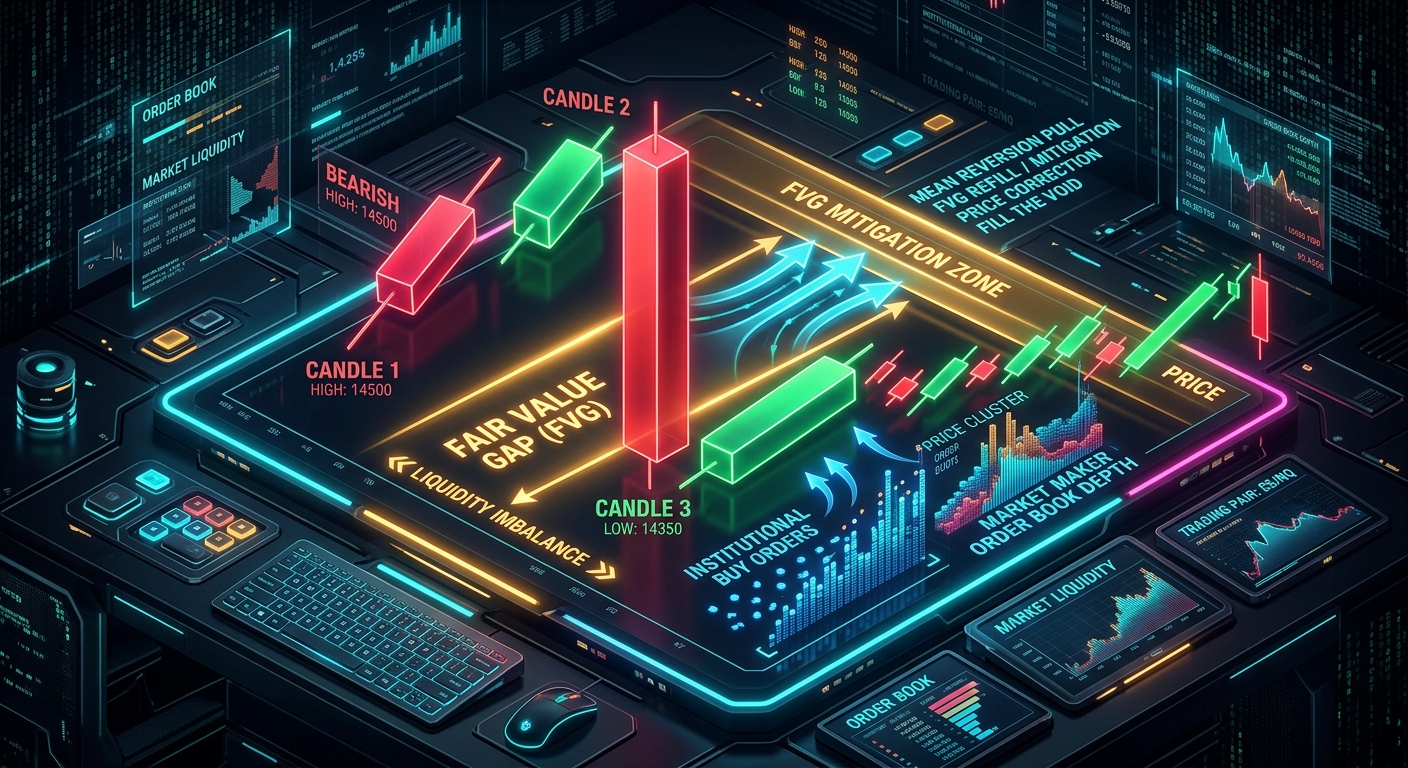
Have you ever watched Bitcoin or Ethereum suddenly explode upward with a massive green candlestick, only to watch the price slowly, methodically drift back down hours later to touch the exact midpoint of that candle before exploding upward again?
Retail traders often call this a "random pullback" or "market noise".
Professional institutional traders and quantitative market makers, however, call it something very specific: The Mitigation of a Fair Value Gap (FVG).
In modern price action theory and institutional order flow (often categorized under Smart Money Concepts or Auction Market Theory), a Fair Value Gap represents a severe structural imbalance in the delivery of market liquidity.
In this comprehensive guide, we dissect the anatomy of Fair Value Gaps, explain the institutional mechanics of why price is magnetically drawn back to fill these voids, and demonstrate how quantitative traders use FVGs in tandem with cross-exchange spread data to time high-probability entries.
1. The Express Train Analogy: What Causes an FVG?
To understand why Fair Value Gaps form, imagine a passenger train running between two major cities with five small towns in between.
[ THE EXPRESS TRAIN VS. MARKET EFFICIENCY ]

  NORMAL HEALTHY AUCTION (All stops served):
  Station A ──► Stop 1 ──► Stop 2 ──► Stop 3 ──► Station B
  (Every price level is traded by both buyers and sellers; order book is balanced.)

  VIOLENT DISPLACEMENT / FVG (Express Train blowing through stops):
  Station A ═══════════════════════════════════► Station B
  (Whale market order sweeps the book in 1 second; middle prices never got offered!)
In a healthy, two-sided financial market, the price ticks up and down smoothly. Limit buy orders and limit sell orders meet at every single cent, ensuring that both buyers and sellers have an equal opportunity to transact (Fair Value).
However, when an institutional participant (like an algorithmic fund, ETF issuer, or crypto whale) deploys a $100 million aggressive market order, the buying pressure completely obliterates the available sell limit orders in the order book.
The price rockets upward so fast that zero two-sided trading occurs at the intermediate price levels. The market was offered exclusively to buyers, leaving a gaping hole in the order book called a Buy-Side Imbalance Sell-Side Inefficiency (BISI).
2. The 3-Candlestick Anatomy: How to Spot an FVG
An FVG is strictly identified across a sequence of three consecutive candlesticks on any timeframe chart:
[ BULLISH FAIR VALUE GAP ANATOMY ]

      Candle 1        Candle 2 (Displacement)       Candle 3
        ┌─┐                    ┌─┐                    ┌─┐
        │ │                    │ │                    │ │
     ───┴─┴─── (High)          │ │                    │ │
                               │ │                 ───┬─┬─── (Low)
         [   EMPTY VOID GAP  ] │ │   <--- [ FAIR VALUE GAP ZONE ]
                               │ │
                               │ │
                              ─┴─┴─

  • Condition: Low of Candle 3 is HIGHER than the High of Candle 1.
  • The space between them is the UNMITIGATED FAIR VALUE GAP.
The Two Types of Fair Value Gaps:
3. Why Price Returns to Fill the Gap (The Mitigation Engine)
Why does price act like a magnet toward these unfulfilled gap zones?
The reason is Market Maker Rebalancing and Algorithmic Re-pricing:
[ THE 3 PHASES OF FVG MITIGATION ]

  PHASE 1: IMPULSE DISPLACEMENT
    • Institutional entity sweeps $50M on Binance, creating a $64,000 to $65,500 FVG.

  PHASE 2: UNFINISHED AUCTION / SPREAD EXPANSION
    • Other exchanges lag; market makers are left with net-short inventory and wide spreads.

  PHASE 3: MEAN-REVERSION & REBALANCING (MITIGATION)
    • Smart money algorithms allow price to retrace into the $64,750 (50% midpoint) zone.
    • Remaining institutional limit orders get filled, restoring balanced liquidity.
    • Price bounces aggressively out of the FVG zone to resume the primary trend.
When an FVG is completely revisited and traded through by subsequent price action, it is officially classified as "Mitigated" or "Balanced".
4. The Institutional Playbook: How Traders Trade FVGs
Professional traders use specific rules of engagement when executing around Fair Value Gaps:
| Strategy Component | Rule / Parameter | Why It Works |
|---|---|---|
| 1. Higher-Timeframe Filter | Only trade FVGs aligned with Daily or 4-Hour Market Structure. | Lowers noise; institutional order flow dominates higher timeframes. |
| 2. Consequent Encroachment (CE) | Target entries at the exact 50% midpoint of the FVG box. | Institutional TWAP algorithms commonly benchmark 50% retracement for limit fills. |
| 3. Invalidation Level (Stop Loss) | Place protective stop-loss just beyond the wick of Candle 1. | If price completely breaches Candle 1, the premise of the imbalance is invalidated. |
| 4. Inversion FVGs (IFVG) | If an FVG fails and gets sliced through, flip the zone into support/resistance. | A failed support imbalance becomes high-probability overhead resistance. |
5. The Link Between FVGs and Cross-Exchange Arbitrage Spreads
While technical chartists look at Fair Value Gaps on single-exchange candlestick charts, quantitative traders look at the underlying cause across multi-venue order books.
When an FVG appears on a Binance chart, what is happening under the hood?
The candlestick chart paints this exact cross-exchange arbitrage rebalancing process as an FVG mitigation!
[ ON-CHART FVG vs. LEVEL-2 CROSS-EXCHANGE SPREAD ]

  On-Chart Candlestick:   [ Huge Green Candle 2 ]  ──►  [ Retrace to 50% FVG Midpoint ]
                                    │                                  │
  Multi-Venue Order Book: [ Binance Price Spikes +1.2% ] ──► [ Arbitrage Closes Spread Gap ]
By monitoring cross-exchange spreads in real time, quantitative traders can identify when an on-chart impulse is an artificial single-exchange anomaly versus a genuine global market breakout.
6. Execution Summary & Best Practices
To integrate Fair Value Gaps into your trading toolkit effectively, keep these principles top of mind: