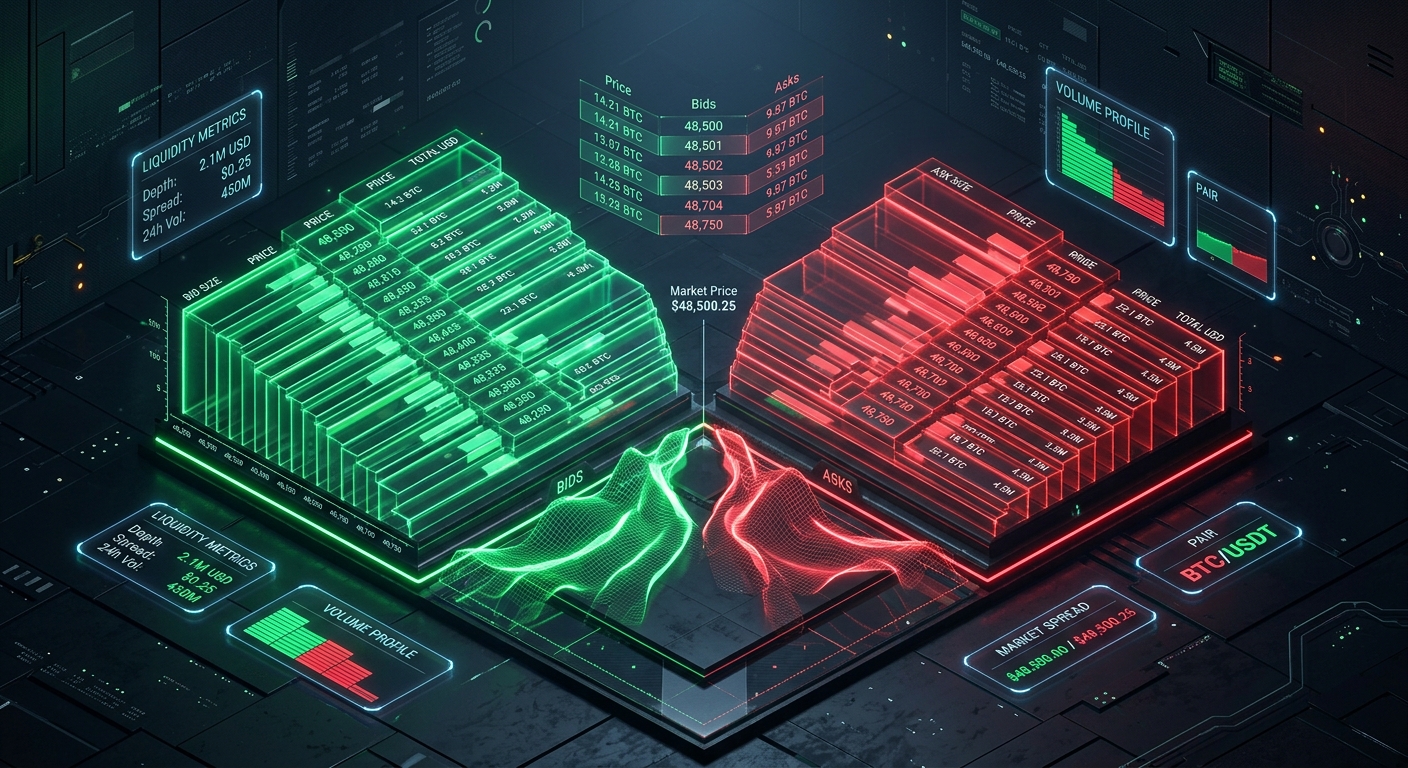
When most traders open a cryptocurrency exchange, their eyes immediately lock onto a single flashing number: the current market price.
If Bitcoin is quoted at $65,000.00, they assume they can buy or sell any amount of Bitcoin at exactly $65,000.00.
This assumption is one of the most expensive misconceptions in financial markets.
The displayed price on any trading screen is nothing more than a historical artifact—it simply reflects the price of the very last transaction matched between two participants.
It tells you nothing about what price you will receive for your next trade, whether the market can handle a $100,000 order without crashing, or whether a sudden $1,000,000 sell-off will drop the price by 0.1% or 15%.
To understand what a cryptocurrency is truly worth and how it will behave when large capital enters the market, you must look beneath the surface into Order Book Depth.
In this quantitative masterclass, we explore the mechanics of Level-2 market microstructure, break down the mathematical formulas behind volume-weighted average price (VWAP) execution, analyze cumulative depth charts, and dissect four real-world financial case studies.
The Anatomy of an Order Book: Level 1, Level 2, and Level 3
Financial exchanges organize trade intentions through structured data hierarchies:
          [ ASKS (Sell Limit Orders) ]  <--- Red Zone (Sellers offering liquidity at higher prices)
          Price: $65,050 | Amount: 4.5 BTC | Cumulative: 12.0 BTC
          Price: $65,025 | Amount: 2.5 BTC | Cumulative: 7.5 BTC
          Price: $65,010 | Amount: 5.0 BTC | Cumulative: 5.0 BTC (Best Ask / Top-of-Book)
----------------------------------------------------------------------------------------
  [ SPREAD: $20.00 (0.0308%) ] <--- Bid-Ask Gap (No resting orders exist in this window)
----------------------------------------------------------------------------------------
          Price: $64,990 | Amount: 3.0 BTC | Cumulative: 3.0 BTC (Best Bid / Top-of-Book)
          Price: $64,975 | Amount: 6.0 BTC | Cumulative: 9.0 BTC
          Price: $64,950 | Amount: 8.0 BTC | Cumulative: 17.0 BTC
[ BIDS (Buy Limit Orders) ] <--- Green Zone (Buyers offering liquidity at lower prices)| Market Data Hierarchy | What It Contains | Update Latency | Primary User / Application |
|---|---|---|---|
| Level 1 (Top-of-Book) | Best Bid price & Best Ask price (BBO) with top-level quantity | Low bandwidth (100ms – 500ms) | Retail price tickers, portfolio tracking widgets, basic mobile apps |
| Level 2 (Market Depth) | Aggregated resting volume across 20 to 1,000 price levels on both sides | High-speed WebSocket (10ms – 50ms) | Active traders, algorithmic market makers, arbitrage scanners |
| Level 3 (Order-by-Order) | Every individual active order ID, queue position, timestamp, and size | Ultra-low latency raw feed (<5ms) | High-frequency trading (HFT) firms, collocated market making desks |
1. What Exactly is Order Book Depth?
Order Book Depth measures the cumulative volume of open, resting limit orders sitting in the market across different price bands away from the current market price.
Depth answers the fundamental question: “How much money does someone have to spend to push the price up or down by 1%, 2%, or 5%?”
Key Properties of Deep vs. Shallow Markets:
2. The Core Mathematical Calculations of Order Book Depth
Formula 1: 1% and 2% Market Depth Metric ($)
Institutional analytics measure depth by summing the total dollar liquidity within a $± 1\%$ or $± 2\%$ range of the mid-market price ($P_{\text{mid}}$):
Bid Depth_{1%} = \sum_{P_i ≥ 0.99 × P_{mid}} (Q_i × P_i)Ask Depth_{1%} = \sum_{P_i ≤ 1.01 × P_{mid}} (Q_i × P_i)If Binance has $25M in 1% bid depth and Bybit has $8M, an institution looking to liquidate $5M of Bitcoin will choose Binance to minimize execution price impact.
Formula 2: Volume-Weighted Average Price (VWAP) & Walking the Book
When an incoming market order exceeds the top-of-book quantity ($Q_1$), the exchange matching engine fills the remainder at the next price levels ($P_2, P_3, \dots, P_k$):
VWAP = \frac{\sum_{i=1}^{k} (P_i × q_i)}{\sum_{i=1}^{k} q_i}Slippage Cost (%) = |(VWAP - P_1) / (P_1)| × 100Where $q_i$ is the actual volume filled at price level $P_i$.
Formula 3: Order Book Imbalance Ratio (OBI)
Quantitative algorithms track the instantaneous ratio between bid and ask pressure to predict short-term microsecond price moves:
OBI = (Total Bid Volume - Total Ask Volume) / (Total Bid Volume + Total Ask Volume)Cumulative Order Book Depth Benchmark Across Major Crypto Venues
| Trading Venue / Asset Pair | 1% Bid/Ask Depth ($) | Typical Top Spread | Market Impact on $100k Order | Microstructure Classification |
|---|---|---|---|---|
| Binance (BTC/USDT) | $18M – $35M | 0.0015% ($1.00) | < 0.005% ($5.00) | Tier-1 Ultra-Deep Institutional |
| Coinbase Advanced (BTC/USD) | $8M – $18M | 0.0015% ($1.00) | < 0.010% ($10.00) | Tier-1 USD Fiat Anchor |
| Kraken Pro (ETH/USD) | $4M – $10M | 0.0050% ($0.15) | < 0.025% ($25.00) | Deep Regulated European/US Hub |
| Bybit (SOL/USDT) | $3M – $7M | 0.0100% ($0.015) | < 0.035% ($35.00) | High-Velocity Derivatives & Spot |
| Uniswap v3 (ETH/USDC 0.05%) | $5M – $15M (Virtual) | 0.0500% (Pool Fee) | < 0.030% ($30.00) | Concentrated Automated Liquidity |
| Mid-Cap Altcoin on Tier-2 CEX | $25k – $80k | 0.3500% ($0.50) | 1.80% – 4.50% ($1,800+) | Shallow / High Slippage Risk |
| Meme Coin on Micro DEX Pool | $2k – $10k | 1.0000%+ | 10.0% – 35.0%+ ($10k+) | Extreme Illiquidity / Trap Zone |
Real-World Case Study 1: The $500,000 Whale Market Buy (Deep vs. Shallow Execution)
To understand why order book depth matters in dollar terms, consider a quantitative fund executing a $500,000 market buy across two different assets:
Asset A: Bitcoin on Binance (Thick Depth)
Asset B: Trending Low-Cap Token on Tier-2 Exchange (Thin Depth)
Real-World Case Study 2: The "Ghost Wall" Spoofing Trap ($2 Million Buy Wall Pulled)
A retail swing trader looked at the Level-2 depth ladder on a mid-cap coin and spotted an enormous $2,000,000 buy order (green bid wall) resting at $50.00, while the current market price was $50.20:
The Quantitative Lesson: Never trust a static order book wall unless you verify its duration, fill history, or use time-weighted average depth metrics.
Real-World Case Study 3: The Arbitrage Capacity Choke ($3,200 Limit on a 4% Gap)
An arbitrage bot detected a massive +4.00% gross price difference on an altcoin between Binance ($20.00) and a regional Korean exchange ($20.80):
The Takeaway: Order book depth defines the maximum capital capacity of any arbitrage opportunity. The wider the price gap, the shallower the order book usually is.
Real-World Case Study 4: Flash Crash Microstructure — The Domino Cascade
During a quiet Sunday morning on an exchange with thin weekend depth:
Traders who understood order book depth placed resting limit buy orders deep in the book ("stink bids") at $2,500, scoring instant +39% rebounds.